ImmunoAnalysis. 4:11.
doi: 10.34172/ia.4097
Mini Review
An Overview on the Nanoparticles-Based Optical Approaches for Determination of Immunosuppressant Pharmaceuticals
Kader Poturcu Conceptualization, Data curation, Formal analysis, Funding acquisition, Investigation, Methodology, Project administration, Resources, Software, Supervision, Validation, Visualization, Writing – original draft, Writing – review & editing, 1, * 
Elaf Mohamed Fauzi Osman Investigation, Visualization, 2
Abdalla Ahmed Elbashir Formal analysis, Project administration, Resources, Supervision, Writing – review & editing, 2
Author information:
1Department of Chemistry, Faculty of Engineering and Natural Science, Suleyman Demirel University, Isparta, Türkiye
2Chemistry Department, Faculty of Science, University of Khartoum, Khartoum, Sudan
Abstract
Immunosuppression is a crucial component of post-transplantation care in renal transplantation, as it helps to improve patient and graft survival rates. However, all immunosuppressants share a characteristic narrow therapeutic index, which means that even small variations in dosage can lead to toxicity or ineffectiveness. Despite the undeniable benefits of immunosuppressants, monitoring of therapeutic levels is essential for maintaining a balance between optimal treatment and adverse effects. This comprehensive review highlights the advancements in optical nanosensors based on nanoparticles over the past decades, displaying their potential applications in detecting immunosuppressant pharmaceutical drugs. The appeal of these sensors lies in their affordability and ease of use, as they do not necessitate complex or costly equipment, making them an attractive option for such applications. It hopes that this review will facilitate the development of new research directions and methodologies in this field, ultimately contributing to its advancement.
Keywords: Nanoparticles, Optical methods, Immunosuppressant
Copyright and License Information
© 2024 The Author(s).
This is an open access article distributed under the terms of the Creative Commons Attribution License (
http://creativecommons.org/licenses/by/4.0/), which permits unrestricted use, distribution, and reproduction in any medium, provided the original work is properly cited.
Funding Statement
This work was supported by the Suleyman Demirel University-BAP--Araştırma Başlangıç Projeleri-FBY-2020-8112.
Introduction
In modern transplantation practices, immunosuppression is a crucial aspect of post-transplant care to ensure the survival of both the patient and the graft. Research has shown that the use of immunosuppressive medications significantly improves patient and graft outcomes.1 Typically, around 6-12 months after transplant, oral maintenance medication is introduced as part of long-term treatment.2 Some of these prescription drugs are cyclosporine A, tacrolimus, sirolimus, everolimus, mycophenolate mofetil, mizoribine, leflunomide and azathioprine. A common characteristic of these drugs is their narrow therapeutic index, which can lead to both adverse effects at high doses and reduced treatment efficacy at low doses.3
Despite significant progress in reducing rejection rates in kidney transplantation, cyclosporine A still pose challenges due to their non-selective immunosuppressive mechanism, which increases the risk of infections and malignancies, as well as toxicity, particularly kidney damage. Furthermore, cyclosporine A ‘s pharmacokinetics are significantly influenced by inter- and intra-individual variability.4 Tacrolimus has been proven effective in preventing graft-versus-host disease. However, its use is limited by adverse effects such as renal damage, neurotoxicity, hypertension, etc., and even low trough concentrations of tacrolimus (4-6 ng.mL-1) can cause nephrotoxicity.5 Azathioprine is a prodrug of 6-mercaptopurine, which has been used for immunosuppression therapy since 1960.6 However, long-term use of azathioprine can lead to various complications, including hepatotoxicity, low white blood cell counts, pancreatitis, and increased risk of cancers and infections.7 Mycophenolate mofetil is a prodrug of mycophenolic acid, a well-tolerated immunosuppressant drug commonly used to prevent graft rejection. However, its use during pregnancy is associated with fetal development defects and a high miscarriage rate, highlighting the need for regular monitoring of pregnant women who take this medication.8 Sirolimus is used to prevent organ rejection by inhibiting T-cell and B-cell activation. It has fewer side effects compared to other immunosuppressants, but may cause thrombocytopenia, hyperlipidemia, infections, and mucositis. It also has limited dosing flexibility and is a costly medication.9 Everolimus is used to treat various types of solid tumors, including hormone receptor-positive breast cancer that does not have HER2 receptors, advanced kidney cancer, pancreatic neuroendocrine tumors, and a rare brain tumor called subependymal giant cell astrocytoma. However, everolimus may cause a decrease in white blood cells, putting one at a higher risk of developing an infection. Additionally, it may also reduce platelet levels, which are essential for blood clotting, potentially increasing the risk of bleeding problems.10 Mizoribine received approval from the Japanese government in 1971.11 It is a type of imidazole nucleotide that works by specifically blocking the activity of an enzyme called inosine-5-monophosphate dehydrogenase, which is involved in the production of purine nucleosides through the de novo synthesis pathway. By doing so, mizoribine prevents the proliferation of T and B lymphocytes. It is prescribed for the treatment of nephrotic syndrome, lupus nephritis, and rheumatoid arthritis. However, the most common side effects of mizoribine use were leucopenia, impaired liver function, rash, elevated uric acid levels, hyperuricemia, and vomiting.12 Leflunomide depletes pyrimidine nucleotides in cells, thereby inhibiting cell growth and proliferation. This can lead to immunosuppression, antiproliferative effects, and potentially even antiviral activity. Additionally, leflunomide’s ability to inhibit protein tyrosine kinases contributes to its immunomodulatory effects, including suppression of immune cell expansion, immunoglobulin production, and increased release of immunosuppressive cytokines. However, It may cause liver damage that can be life-threatening and even cause death.13
These drawbacks underscore the importance of therapeutic drug monitoring (TDM) for immunosuppression therapy in post-renal transplantation follow-up. The primary goal of TDM is to achieve a balance between an optimal therapeutic dose and minimizing toxicity and adverse effects.14
Conventional analytical methods used for detecting immunosuppressants have primarily relied on immunoassay and chromatography techniques. However, these methods have several limitations, including high costs, time-consuming analysis, and instability. Furthermore, immunoassay systems are often affected by cross-reactivity issues with antibodies, compromising their sensitivity. Chromatography methods, although highly sensitive and selective, require expensive equipment and skilled personnel to interpret results. Therefore, there is a need for rapid and easy-to-use analytical methods that can be adapted for point-of-care (POC) applications, enabling continuous determination of immunosuppressant concentrations in biological fluids.
Nanotechnology encompasses the application of extremely small materials across various scientific disciplines, including chemistry, biology, physics, materials science, and engineering. In medical diagnostics and biotechnology, optical methods are dominant, but they have limitations. For instance, the detection limits of these methods are often restricted by the quantum yield of the fluorophore or chromophore, auto-fluorescence of the sample, and photo-stability. Over the past few decades, nanoparticles have been widely used to enhance the spectral properties of fluorophores/chromophores, alleviating some of their traditional photo-physical constraints 15,16. Not only do nanoparticles improve the limit of detection (LOD), but they also enhance the selectivity and sensitivity of analytical methods.
This study aims to provide a comprehensive review of nanoparticle-based methods for detecting the mentioned immunosuppressive drugs. It is worth noting that some recent reviews by Seyfinejad and Jouyban14 and Golsanamlou et al17 were published in 2021. However, the Seyfinejad and Jouyban14 study was related to the chromatography method for determination of immunosuppressant and Golsanamlou et al17 reported the optical and electrochemically method for determination of some limited immunosuppressant. This work will be an update for these studies and cover nanoparticle-based optical sensors for detecting some of these prescribed drugs such as cyclosporine A, tacrolimus, sirolimus, everolimus, mycophenolate mofetil, mizoribine., leflunomide and azathioprine which categorized based on the drug type. A literature search was conducted using the Scopus and PubMed databases.
Detection principal in nanoparticle-based optical systems
Nanoparticle-based optical systems are used in spectrophotometry and spectrofluorimetry methods for the detection of analytes, and the detection principle relies on the interaction between the nanoparticles and the analyte molecules.18 In direct detection, nanoparticles are specifically designed to bind to the analyte of interest, causing a change in their optical properties, such as absorption, emission, or scattering characteristics, which is then measured using spectroscopic techniques like UV-Vis spectroscopy or fluorescence spectroscopy.19 For example, a nanoparticle-based biosensor that detects a drug would be designed with nanoparticles conjugated with an antibody that specifically recognizes that drug. When the desired drug binds to the antibody-nanoparticle complex, it alters the optical properties of the nanoparticles, allowing for its detection.
Indirect detection methods involve nanoparticles interacting with the analyte through a secondary mechanism, often used when direct detection is challenging or impractical.19 For example, a nanoparticle-based sensor that detects a drug would recognize and bind to a secondary molecule present in abundance in the blood plasma. When that drug binds to this secondary molecule, it changes its conformation or binding properties, which is then detected using spectroscopic techniques.
Spectrophotometry measures the amount of light absorbed or transmitted by a sample at specific wavelengths. In nanoparticle-based spectrophotometry, nanoparticles absorb light at specific wavelengths due to their unique optical properties, and when an analyte binds to the nanoparticles, it changes their absorption spectrum, allowing for detection. Alternatively, nanoparticles can scatter or reflect light at specific wavelengths, which can be detected using transmittance spectroscopy.20
Spectrofluorimetry methods rely on the emission of light by excited nanoparticles when exposed to an external energy source. Fluorescence quenching or enhancing occurs when the presence of an analyte causes a decrease or increase in fluorescence emission due to interactions with the nanoparticles.21
Nanoparticle-based optical systems offer several advantages, including high sensitivity due to their unique optical properties, specificity through conjugation with target-specific molecules, multiplexing capabilities to detect multiple analytes simultaneously, and portability due to miniaturization and integration into portable devices.22
Developed nanoparticle-based methods for detection of selected immunosuppressants
The nanoparticle-based detection methods reported here are categorized based on the immunosuppressant drug type. An overview of the reported methods along with their analytical features is provided in Table 1, with a detailed explanation of each method in the following sections. It should be noted that we did not find any nanoparticle-based optical method for determination of everolimus, mizoribine and leflunomide which can report here and hope that this research will be a guideline for further research in this field for other unworked drugs. A total of 10 relevant articles were identified for the given keywords and the following sections provide a brief summary of each report.
Table 1.
Analytical features of the reported nanoparticles-based optical method in the literature for determination of immunosuppressant pharmaceuticals
|
Analyte
|
Method
|
Nanoparticle
|
Mechanism
|
Investigated matrix
|
Linear range
|
Detection limit
|
Reference
|
| Cyclosporine A |
Spectrophotometry |
AgNPs |
Nanoparticles aggregation |
Plasma and drug formulation |
Water: 0.002-0.100 μmol.L-1 Plasma: 0.17-0.85 μmol.L-1 |
- |
23
|
| Spectrofluorimetry |
Silica nanoparticle-immobilized GDH protein |
Tracking the enzymatic activity of GDH, which can affect by interaction with cyclosporine A, by monitoring changes in the fluorescence of phenazine methosulfate |
Blood, serum, urine, and saliva |
2-15 pmol.L-1 |
2 pmol.L-1 |
24
|
| Ratiometric fluorescence |
ZIF-8-AgNPs@NE probe |
Probe fluorescence quenching was reported to be inner filter effect |
Plasma |
0.01 - 0.5 μg mL−1
0.5 - 10 μg mL−1 |
0.007 μg mL−1. |
25
|
| Tacrolimus |
Visual examination |
Gold nanoparticle |
When tacrolimus is present, the GNP-labeled mAbs on the conjugate pad capture it as it migrates through the strip, binding to the coating antigen on the T line. This leaves no mAbs available to react with goat anti-mouse IgG-HRP on the C line, resulting in a colorless T line, indicating a positive result for tacrolimus presence. |
Whole blood |
- |
1.0 ng.mL-1 |
26
|
| Spectrophotometry |
Norepinephrine modified AgNPs |
Aggregation |
Plasma |
2 ng.mL-1 - 70 ng.mL-1
70 ng.mL-1 - 1000 ng.mL-1, |
0.1 ng.mL-1 |
27
|
| Spectrofluorimetry |
(g-C3N4)@La:Y2O3 nanocomposite |
formation of a non-fluorescent complex between g-C3N4@La:Y2O3 nanocomposites and tacrolimus |
pharmaceutical compounds |
0-4 μmol.L-1 |
0.017 μmol.L-1 |
28
|
| Azathioprine |
Chemiluminescence |
AgNPs catalyzed calcein–KMnO4 system |
The enhancement of the weak signal of calcein–KMnO4 chemiluminescence system by adding AgNPs in the presence and proportional to concentration of azathioprine due to the energy transfer to the unreacted calcein molecules for emitting |
Pharmaceutical compounds |
5.0 × 10⁻³ - 2.0 × 10⁻³ µmol.L-1 |
2.6 × 10⁻⁴ µmol.L-1 |
29
|
| Spectrophotometry |
AgNPs/ PVA/CS |
Preventing nucleation and growth of the nanoparticles due to interaction between the sulfur and nitrogen atoms in azathioprine 's molecular structure with the Ag ions already present on the probe |
Tablet formulations and human serum |
0.14-2.88 μmol.L-1 |
0.09 μmol.L-1 |
30
|
| Sirolimus |
Visual test |
Gold nanoparticles |
In sirolimus-positive samples, the antibodies bind to the colloidal gold-mAbs, causing the T line to turn red. |
Whole blood |
20 ng.mL-1 |
|
31
|
| Mycophenolic acid |
Fluorescence and colorimetric |
(PEI)70,000 and CdTe@SiO2 |
Increase in mycophenolic acid’s fluorescence intensity in the presence of PEI and acting CdTe@SiO2 as a built-in correction factor and a reference signal for ratiometric detection of mycophenolic acid |
Plasma |
0.5-50 μg.mL-1 |
Fluorescence: 33 ng.mL-1
Colorimetric: 83 ng.mL-1 |
27
|
Cyclosporine A
In a direct determination method, Jahed et al 23 used dopamine-capped silver nanoparticles (AgNPs) as a colorimetric probe for detection of cyclosporine A in human plasma and drug formulation samples. They reported that the dopamine-capped AgNPs exhibit a characteristic peak at 410 nm. However, when cyclosporine A is added, a new peak emerges at 600 nm, indicating the aggregation of the AgNPs. Moreover, the suspension of AgNPs changes color from yellow to brown, providing a visual indication of the interaction between the AgNPs and cyclosporine. The method showed a linear response toward cyclosporine A in the concentration range of 0.002-0.100 μmol.L-1 and 0.17-0.85 μmol.L-1 in water and plasma, respectively. In another work with indirect determination basis, Wells et al24 reported a silica nanoparticle-immobilized glucose dehydrogenase protein (GDH) for fluorimetric determination of cyclosporine A in human blood, serum, urine, and saliva samples. They constructed a biosensor array by depositing silica nanoparticle-immobilized GDH protein on the fiberglass sheets. The array can be stored in dry form and can be quantitatively detected using a smartphone camera, highlighting the method’s potential for use in field-based and POC settings (Figure 1). The enzymatic activity of GDH, which can affect by interaction with cyclosporine A, was tracked by monitoring changes in the fluorescence of phenazine methosulfate (excitation wavelength: 365 nm; emission wavelength: 465 nm). Herein, phenazine methosulfate was used as an electron mediator which the fluorescence of its reduced state was used for analyte tracing. The method can be used for determination of cyclosporine A in the range of 2-15 pmol.L-1.
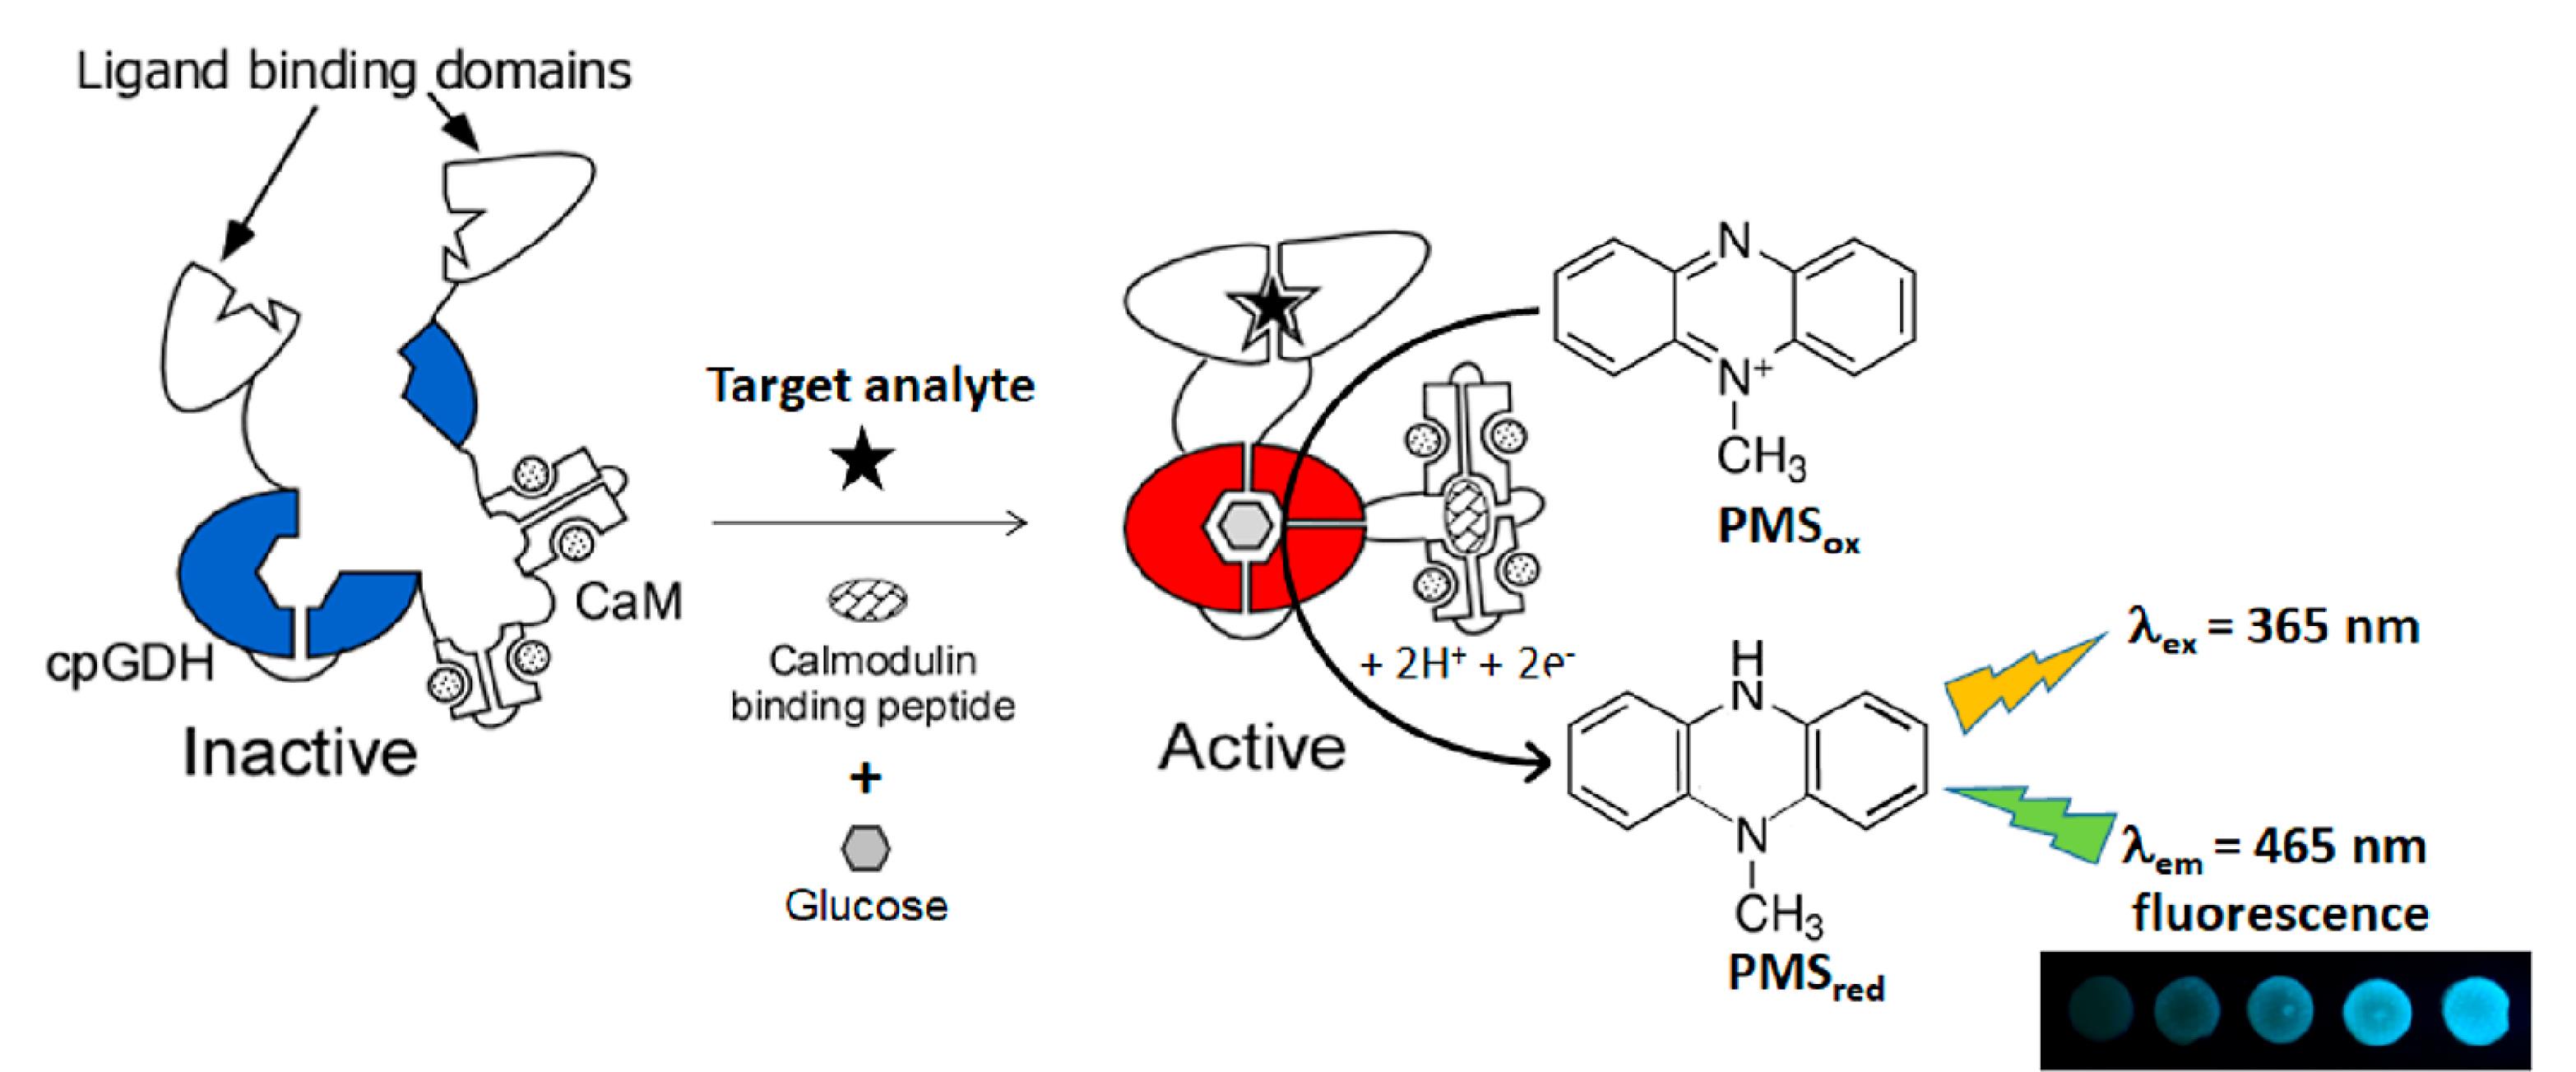
Figure 1.
Schematic illustration of the GDH-based biosensor, which generates a fluorescence output signal. The diagram shows the components involved: circularly permuted GDH (cpGDH), glucose dehydrogenase (PQQ), calmodulin (CaM), and phenazine methosulfate in its reduced (PMSox) and oxidized (PMSred) forms. Reproduced with permission of the publisher.24
.
Schematic illustration of the GDH-based biosensor, which generates a fluorescence output signal. The diagram shows the components involved: circularly permuted GDH (cpGDH), glucose dehydrogenase (PQQ), calmodulin (CaM), and phenazine methosulfate in its reduced (PMSox) and oxidized (PMSred) forms. Reproduced with permission of the publisher.24
Golsanamlu et al25 used a ratiometric fluorescent sensor based on zeolitic imidazolate framework (ZIF-8) and norepinephrine-capped silver nanoparticles (AgNPs@NE) for determination of the cyclosporine A in plasma sample. By cyclosporine A addition, the fluorescent emission intensity of the ZIF-8-AgNPs@NE probe is reduced across two linear ranges: 0.01 to 0.5 μg mL−1 and 0.5 to 10 μg mL−1. This method detected cyclosporine A with a low LOD of 0.007 μg mL−1. The reported mechanism for probe fluorescence quenching was reported to be inner filter effect which can be related to overlapping the absorbance spectra of cyclosporine A and ZIF-8-AgNPs@NE in the wavelength range of 250-400 nm.
Tacrolimus
Jiang et al26 developed colloidal gold nanoparticle-based immunochromatographic strip (CG-ICS) to detect tacrolimus in human whole blood using the monoclonal antibody 4C5. The test strip consists of several layers. The first layer is a polyvinyl chloride backing plate. On top of this, two lines were created on a nitrocellulose (NC) membrane. One line, the T line, was coated with an antigen, while the other, the C line, was treated with goat anti-mouse IgG-HRP. The NC membrane was then dried for 12 hours at 37 °C. A conjugate pad containing GNP-labeled mAbs was attached to the NC membrane near the T line, and an absorbent pad was added with a 2 mm overlap with the NC membrane near the C line. The finished strips were cut into 3 mm wide pieces and stored in a dry environment for future use. After the sample solution was added to the test strip, it migrated to the absorbent pad under capillary action. The gold nanoparticles-labeled mAbs on the conjugate pad followed the sample and captured tacrolimus present in the solution. As it passed through the T line, unbound mAbs bound to the coating antigen, creating a light red band. The remaining mAbs then combined with goat anti-mouse IgG-HRP on the C line, resulting in a second red band. If there was sufficient tacrolimus in the sample, all mAbs were bound, leaving the T line colorless. In contrast, samples with no tacrolimus would display two distinct red bands on the NC membrane. Through visual examination, the visual limit of detection (vLOD) and cutoff value for qualitative detection were determined to be 1.0 ng.mL-1 and 20.0 ng.mL-1, respectively. In another work, Golsanamlu et al27 reported a direct colorimetric platform based on the norepinephrine modified AgNPs for quantification of tacrolimus in plasma samples. It has been established that catecholamines like dopamine and norepinephrine can form strong chemical bonds on material surfaces through an oxidation reaction under alkaline conditions. Specifically, the two hydroxyl groups on norepinephrine transfer electrons to form a quinone structure on the surface of AgNPs, while the alkylamine groups stabilize the AgNPs. As shown in Figure 2, the color and UV-Vis absorption spectrum of the AgNPs change dramatically in the presence and absence of tacrolimus. When tacrolimus is added, the suspension’s color shifts from yellow to reddish-brown, indicating AgNP aggregation. The binding reaction between tacrolimus and norepinephrine -functionalized AgNPs causes aggregation, resulting in a visible color change. Notably, no reaction occurs between tacrolimus and AgNPs in the absence of norepinephrine, and the mixture remains colorless. The developed nanoprobe is capable of detecting tacrolimus concentrations in plasma samples across two linear ranges, specifically from 2 ng.mL-1 to 70 ng.mL-1 and 70 ng.mL-1 to 1000 ng.mL-1, with LOD of 0.1 ng.mL-1.
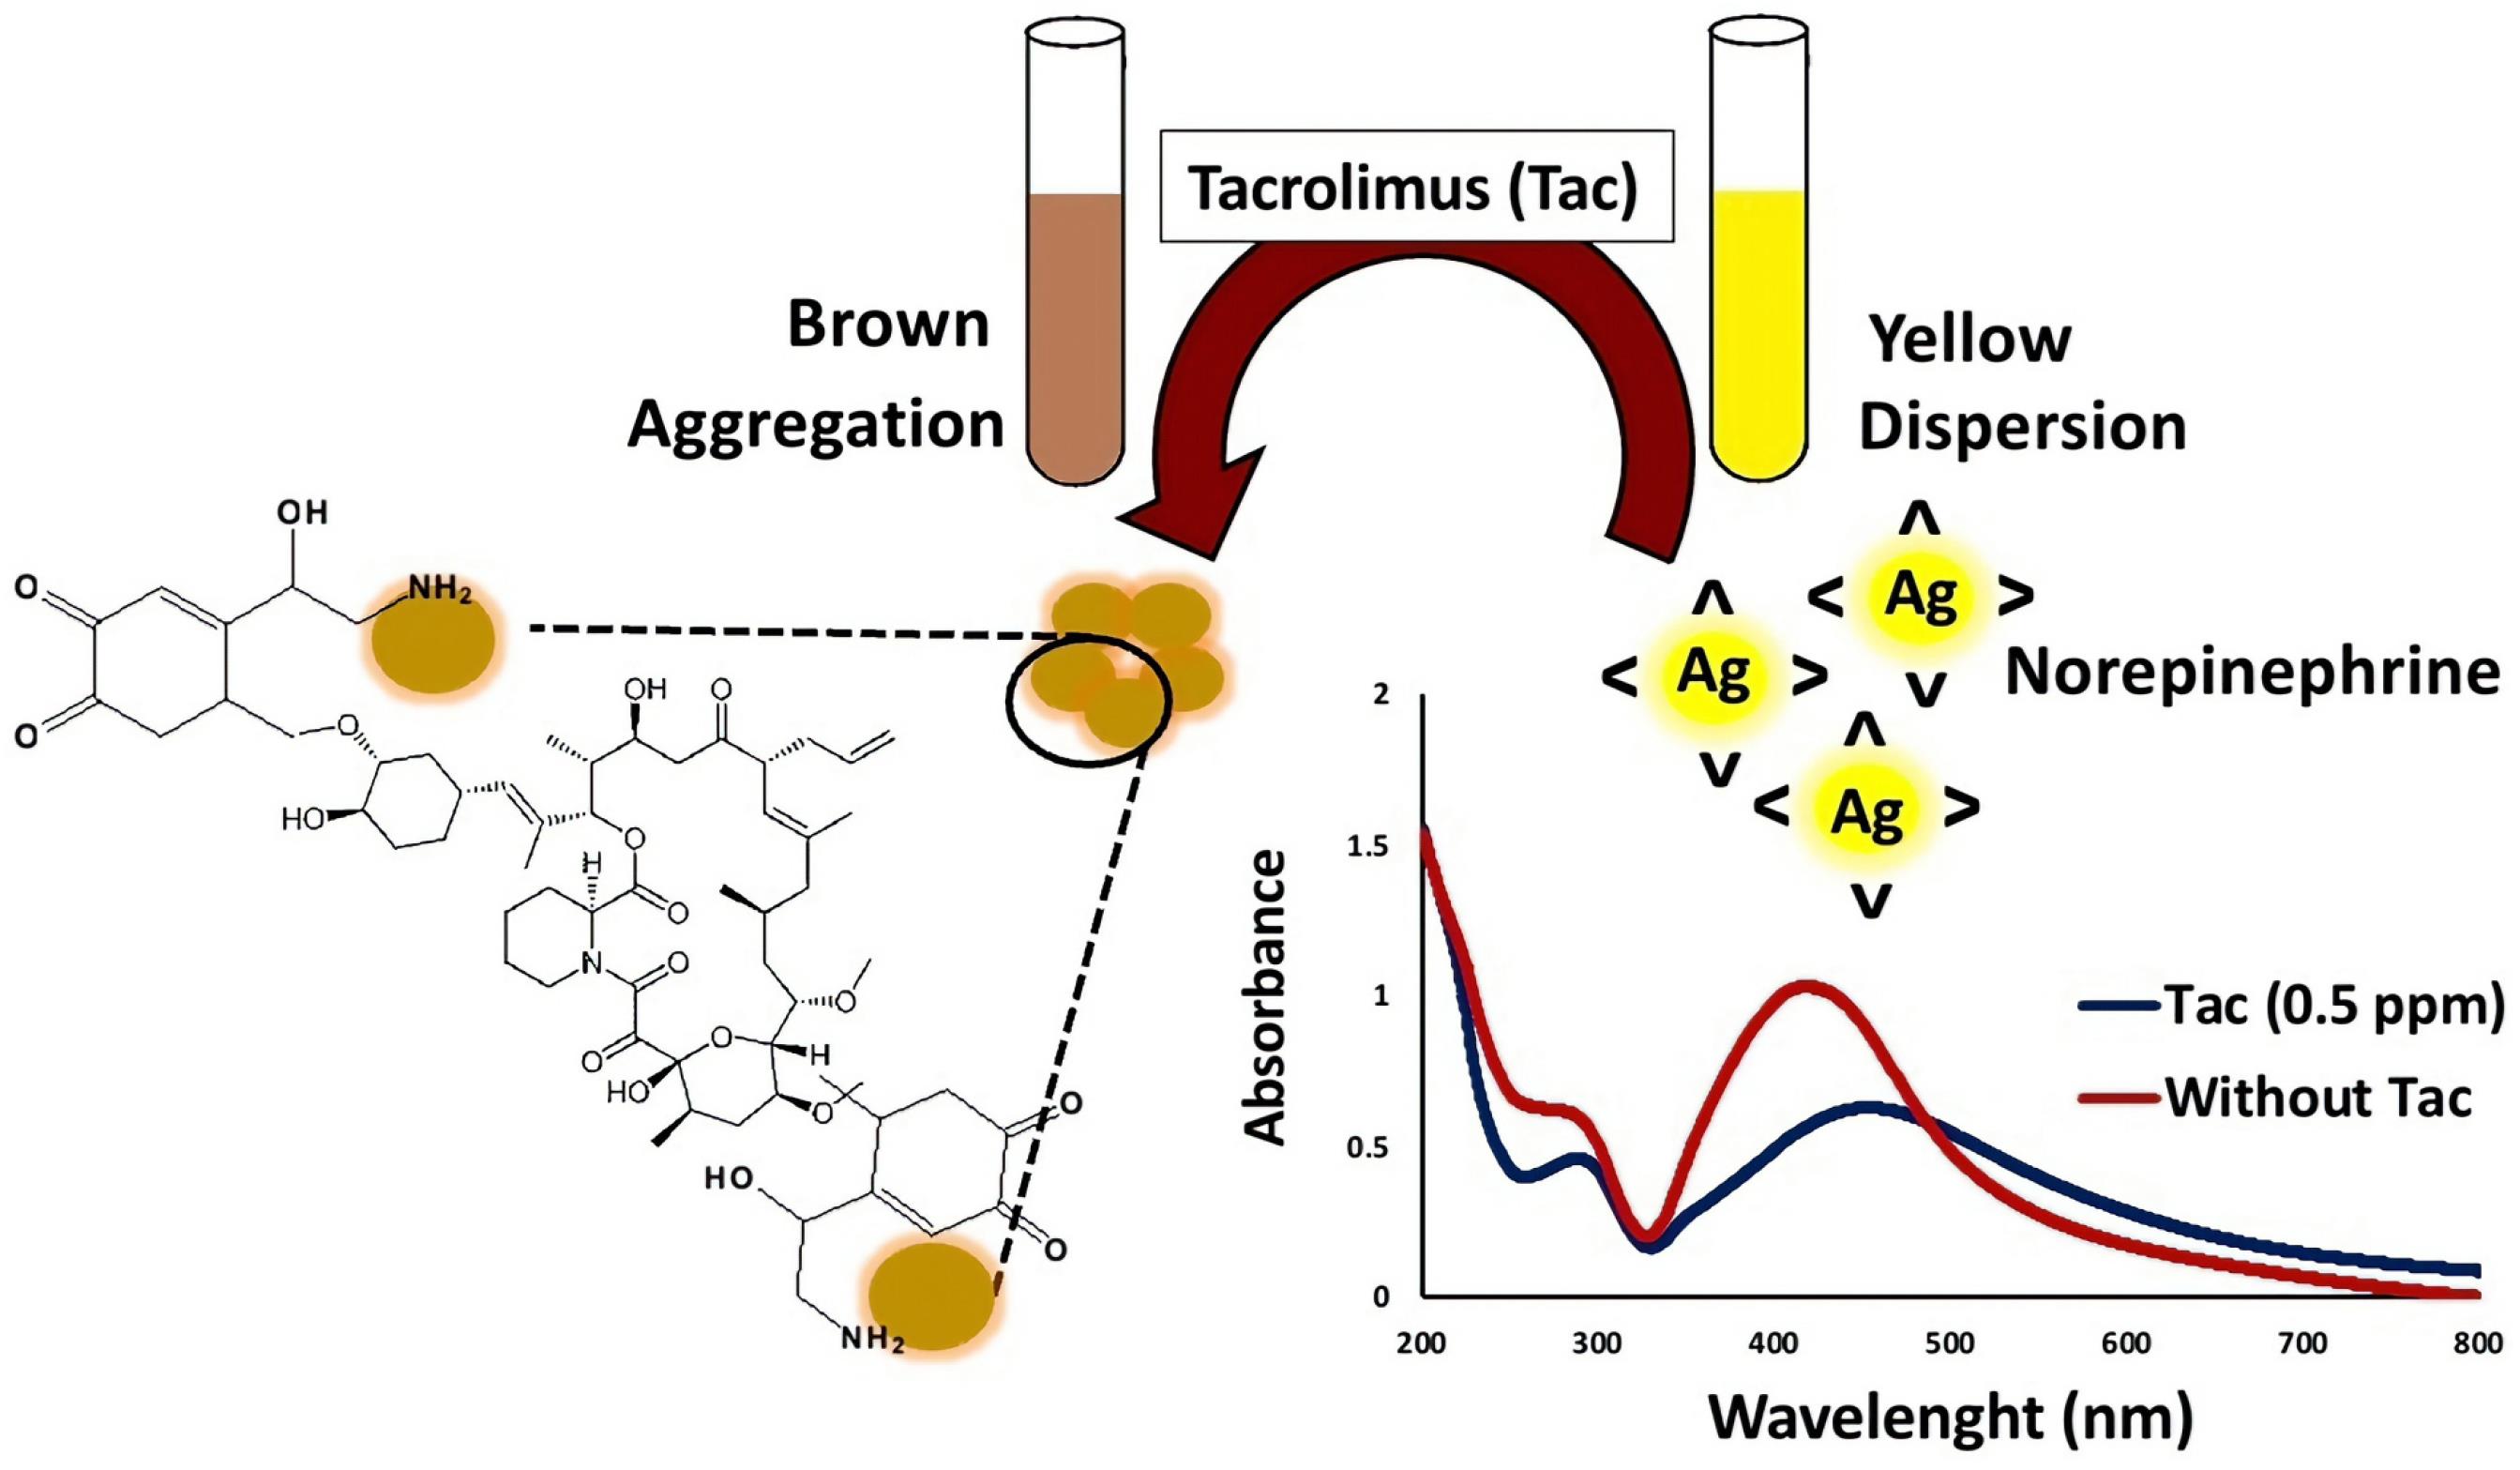
Figure 2.
An illustration of the colorimetric detection process for tacrolimus using AgNPs functionalized with norepinephrine. Reproduced with permission of the publisher.27
.
An illustration of the colorimetric detection process for tacrolimus using AgNPs functionalized with norepinephrine. Reproduced with permission of the publisher.27
In another work in direct determination mode, Zolgharnein et al28 synthesized graphitic carbon nitride (g-C3N4)@La:Y2O3 nanocomposite by thermal polymerization of melamine and used a fluorescence sensor to detection and determination of tacrolimus in the pharmaceutical compounds. The presence of tacrolimus results in the suppression of fluorescence emission intensity at 369 nm in this nanosensor. The possible mechanism for this phenomenon is formation of a non-fluorescent complex between g-C3N4@La:Y2O3 nanocomposites and tacrolimus before excitation. As a result, the quenching effect observed by tacrolimus is classified as a static type, meaning that the complex formation precedes excitation and quenches the fluorescence emission. This assay demonstrated a linear range of 0-4 μmol.L-1, with a detection limit of 0.017 μmol.L-1 and the quantification limit of 0.058 μmol.L-1.
Azathioprine
Mohammad Almahri and Jabli29 reported a AgNPs catalyzed calcein–KMnO4 chemiluminescence system for direct determination of azathioprine in the pharmaceutical preparation. The method mechanism was the enhancement of the weak signal of calcein–KMnO4 chemiluminescence system by adding AgNPs in the presence and proportional to concentration of azathioprine. It can be related to the energy transfer to the unreacted calcein molecules for emitting. The analytical curves showed a linear relationship across the concentration ranges of 5.0 × 10⁻³ to 2.0 × 10⁻³ µmol.L-1 and the LOD of 2.6 × 10⁻⁴ µmol.L-1. In another work, Barkat Rezaei et al30 used a smart probe by incorporating the features of electrospun poly (vinyl alcohol)/chitosan (PVA/CS) nanofibers and surface plasmon resonance of AgNPs for azathioprine analysis in tablet formulations and human serum samples. Silver ions were covalently bonded to the surface of PVA/CS nanofibers through the amino groups in the chitosan framework, followed by reduction with ascorbic acid, resulting in the formation of AgNPs on the nanofiber surface (Figure 3). The presence of azathioprine during the reduction process, however, hindered the formation of AgNPs on the surface, thereby reducing the plasmon resonance intensity of the nanoparticles. It is likely that the presence of azathioprine hinders the formation of AgNPs on the nanofiber surface due to the interaction between the sulfur and nitrogen atoms in azathioprine ‘s molecular structure with the Ag+ ions already present on the nanofibers, thereby preventing nucleation and growth of the nanoparticles. The method demonstrated a linear correlation between analytical response and azathioprine concentration within the range of 0.14-2.88 μmol.L-1, with a detection limit of 0.09 μmol.L-1.
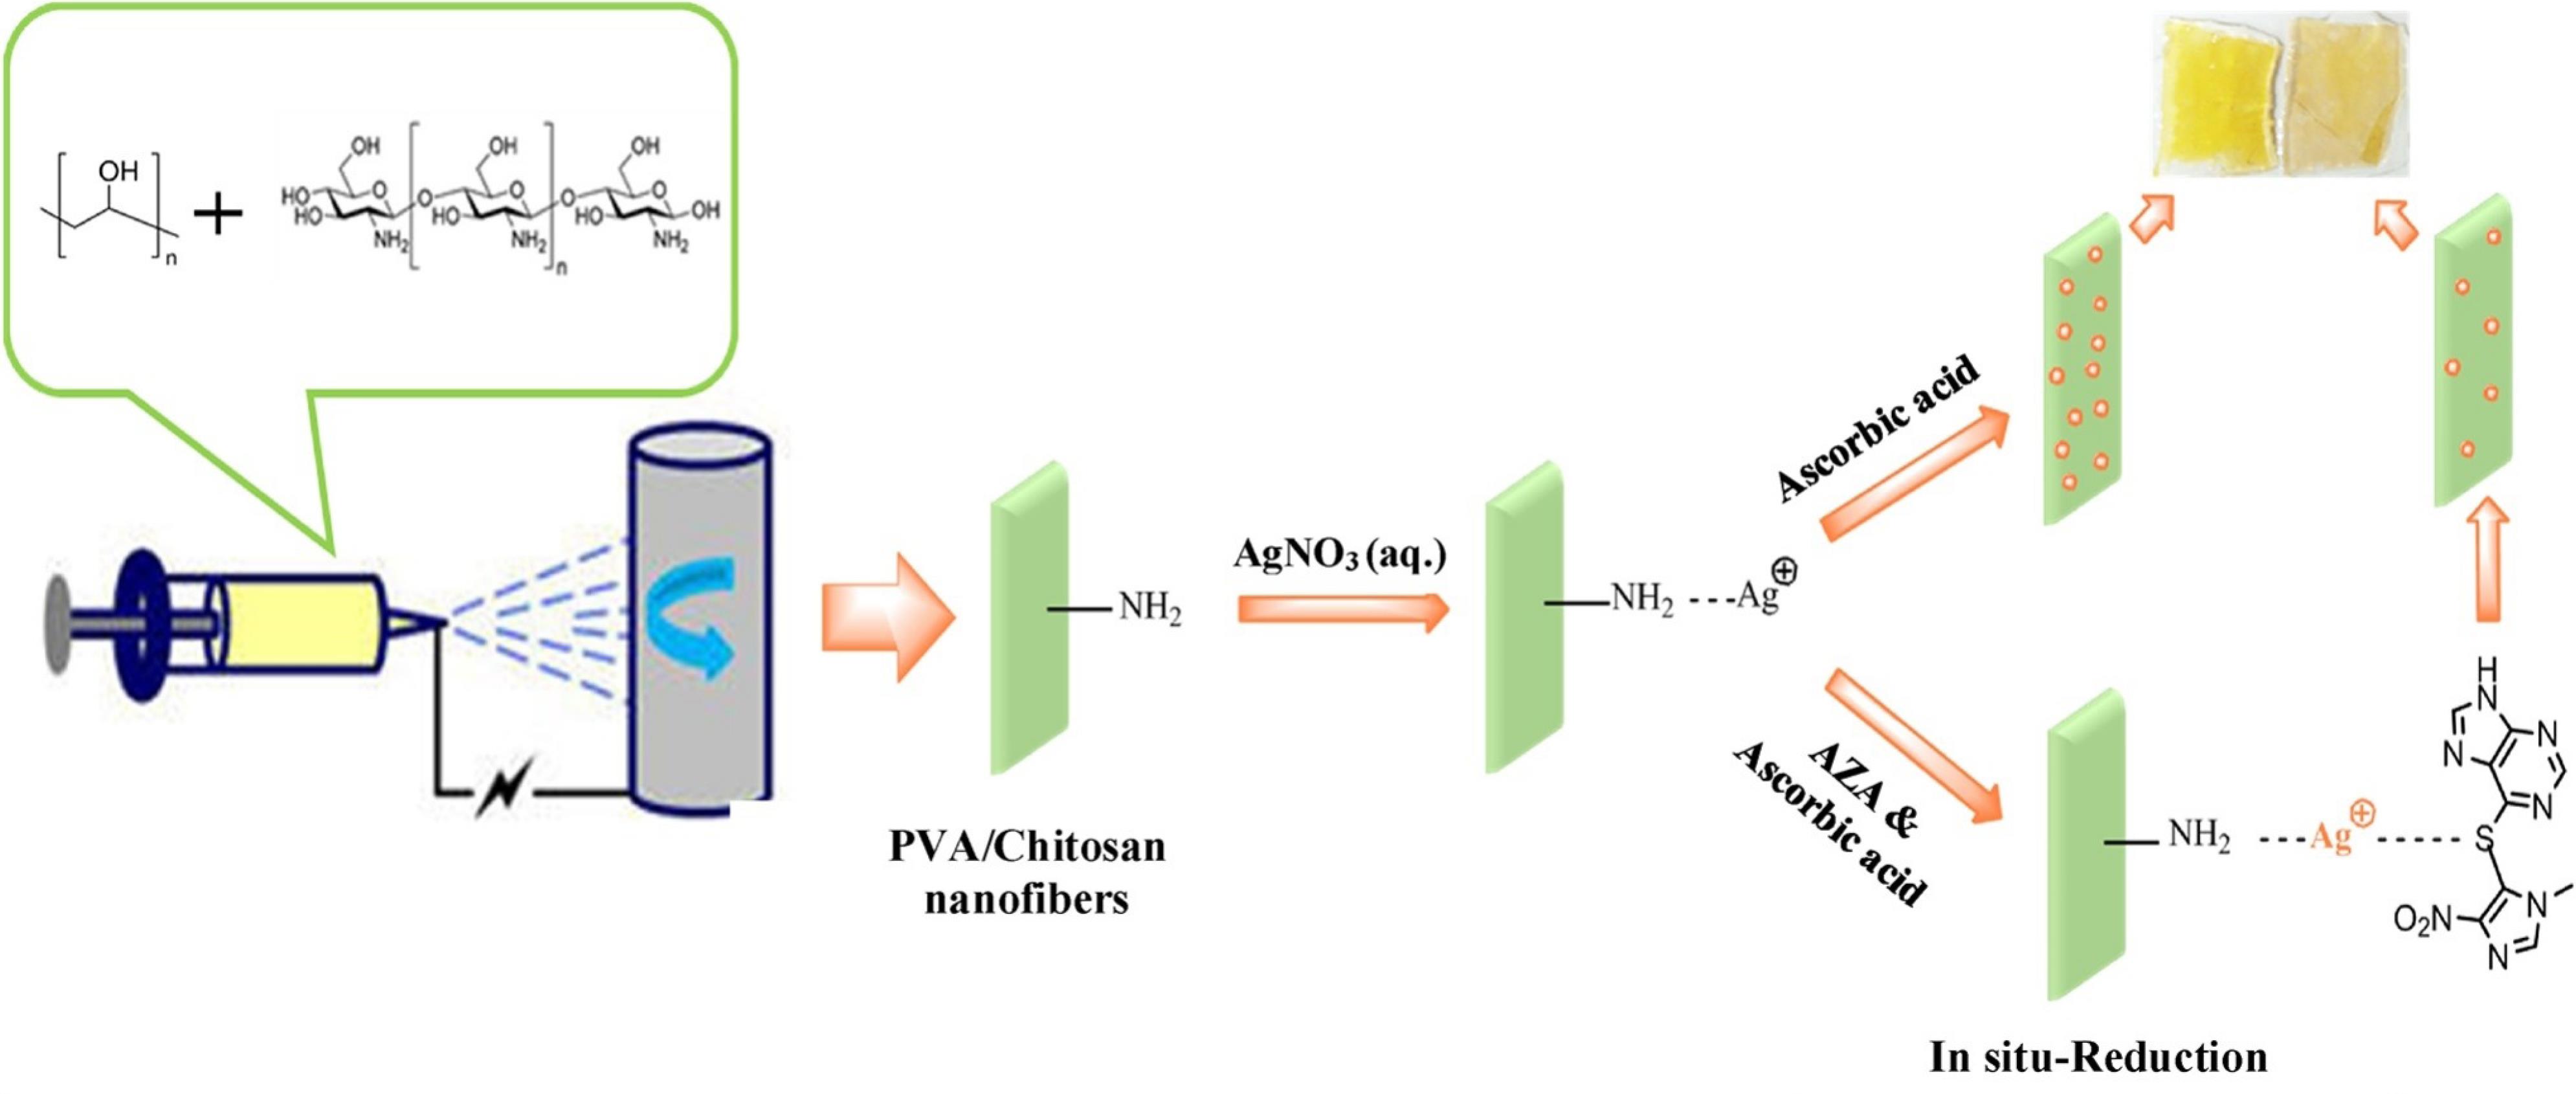
Figure 3.
A schematic illustration of biosensor developed by combining the unique properties of electrospun PVA/CS nanofibers and surface plasmon resonance of AgNPs for the detection of azathioprine. Reproduced with permission of the publisher.30
.
A schematic illustration of biosensor developed by combining the unique properties of electrospun PVA/CS nanofibers and surface plasmon resonance of AgNPs for the detection of azathioprine. Reproduced with permission of the publisher.30
Sirolimus
Jiang et al31 used an efficient CG-ICS using colloidal gold to quick and screening for sirolimus in a one-step process. The strip consists of a sample pad, an absorption pad, and two lines (T and C). When a sample solution is added to the strip, the colloidal gold-mAbs migrate upwards by capillary action. In samples that contain sirolimus, these antibodies bind preferentially to the colloidal gold-mAbs. The remaining mAbs then combine with sirolimus- carboxymethoxylamine hemihydrochloride (CMO) - bovine serum albumin (BSA) immobilized on the T line, causing it to turn red. As the concentration of sirolimus increases, the T line becomes progressively lighter and eventually disappears if the concentration is high enough to bind all the colloidal gold-mAbs. The C line, which contains goat anti-mouse IgG antibody, captures free colloidal gold-mAb and remains red in all cases. However, in sirolimus-negative samples, all the colloidal gold-mAbs are bound to sirolimus-CMO-BSA and goat anti-mouse IgG, resulting in both lines turning red. The strip’s vLOD was demonstrated to be 20 ng.mL-1 in whole blood samples, with a cut-off value of 100 ng.mL-1, as visually detected by the naked eye without the need for specialized equipment.
Mycophenolic acid
Shi et al32 validated a fluorescence and colorimetric dual-readout probe based on the poly ethylenimine (PEI)70,000 and CdTe@SiO2 for determination of mycophenolic acid in plasma samples (Figure 4). The presence of PEI significantly enhanced the blue fluorescence emitted by mycophenolic acid, while the red fluorescence of CdTe@SiO2 quantum dots served as a stable reference signal. When exposed to an alkaline environment, the carboxyl and phenolic hydroxyl groups of mycophenolic acid are expected to lose their hydrogen ions, resulting in the formation of phenolate anions. This change enhances the conjugation of the molecule, ultimately leading to an increase in mycophenolic acid’s fluorescence intensity. Whereas, the CdTe@SiO2 nanomaterial with SiO2 shield and red fluorescence has the potential to serve as a built-in correction factor and allowing for a reliable reference signal for ratiometric detection of mycophenolic acid. The fluorescence response was linear between 0.5-50 μg.mL-1, with a LOD of 33 ng.mL-1. The fluorescent colorimetric card as a semi-quantitative detection method for mycophenolic acid, with visual color changes from red to violet to blue showed a linear response for concentrations from 0.5 to 50 μg.mL-1. The Color Collect App enabled quantitative detection with a LOD of 83 ng.mL-1.
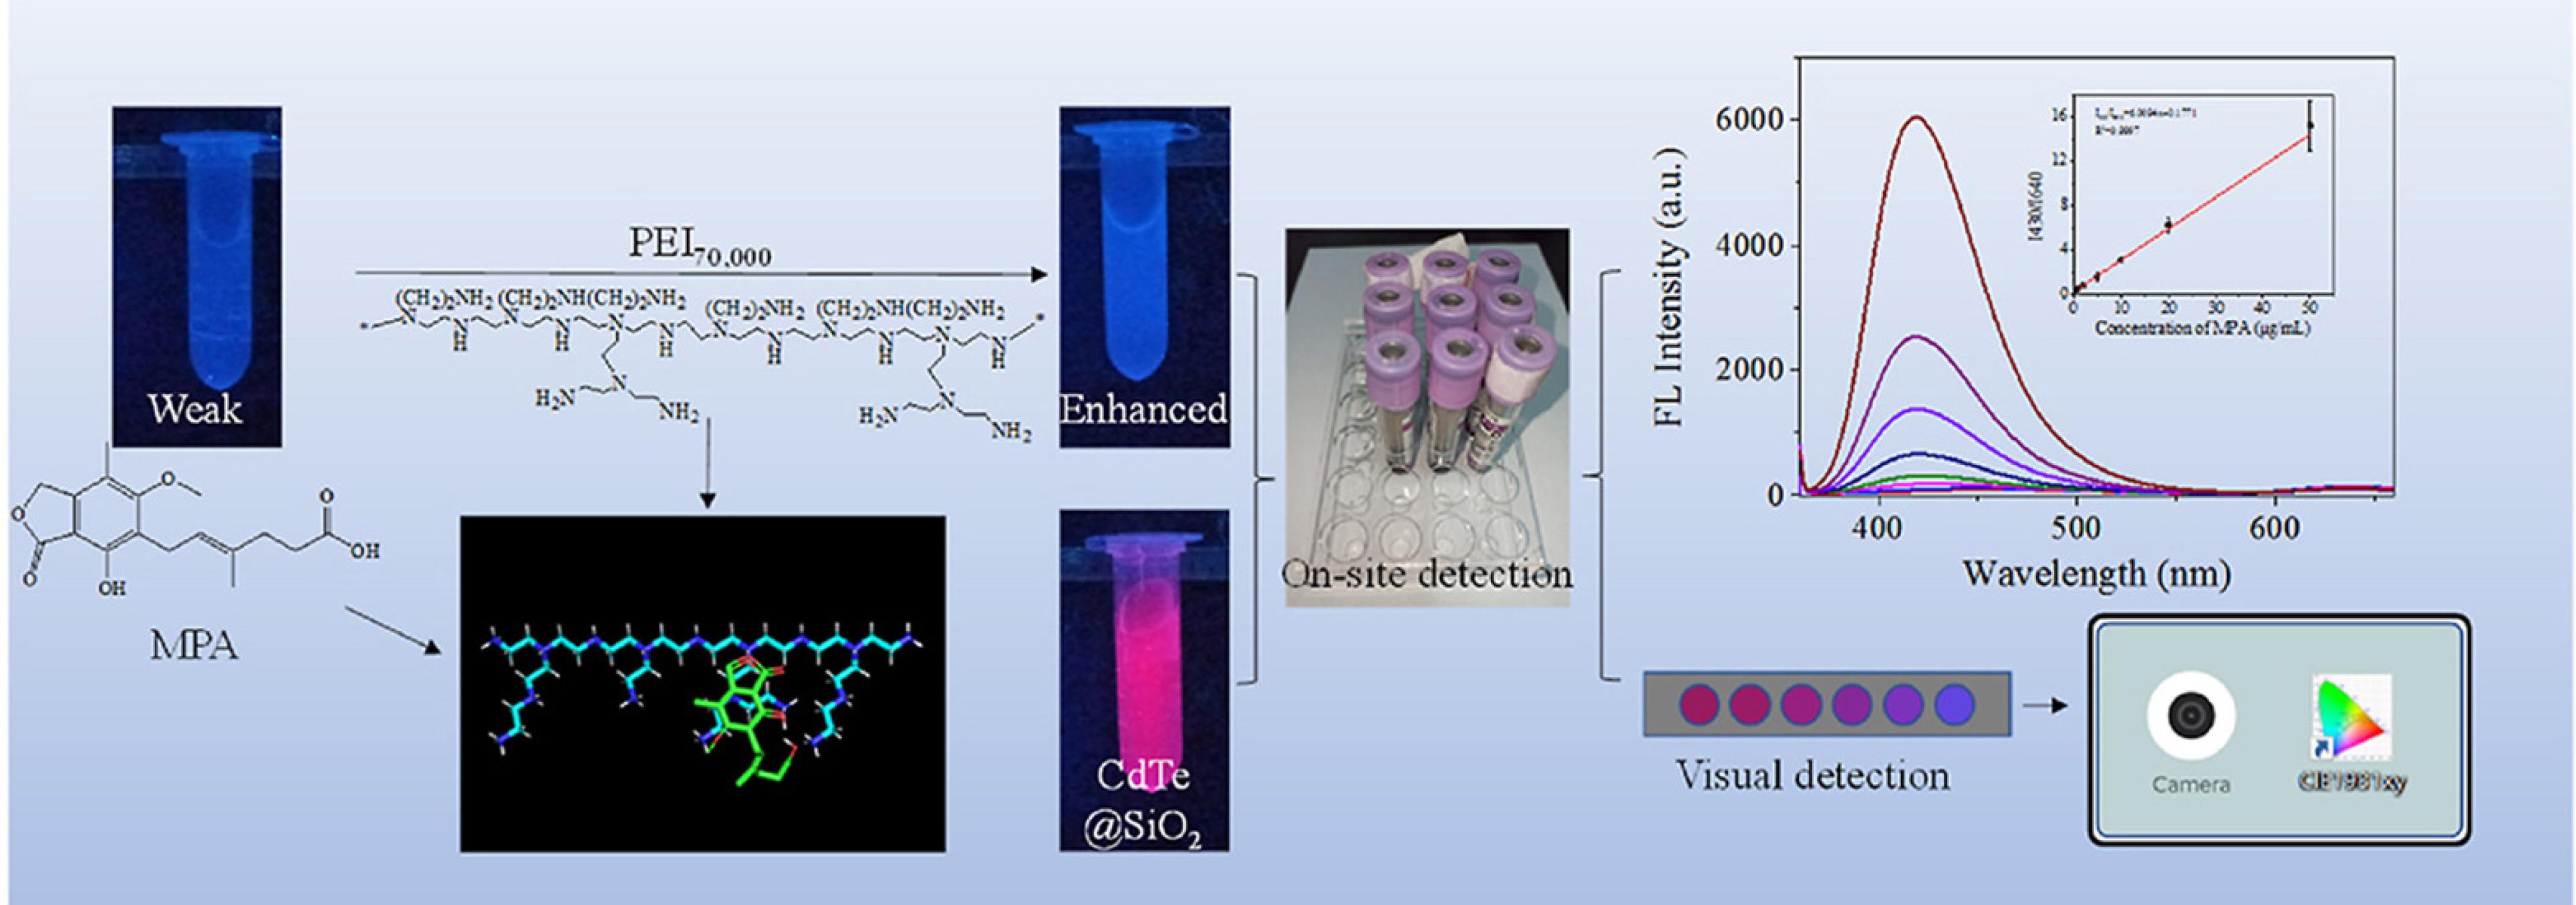
Figure 4.
A schematic illustration of a fluorescence and colorimetric dual-readout probe based on the poly ethylenimine (PEI)70,000 and CdTe@SiO2 for determination of mycophenolic acid. Reproduced with permission of the publisher.32
.
A schematic illustration of a fluorescence and colorimetric dual-readout probe based on the poly ethylenimine (PEI)70,000 and CdTe@SiO2 for determination of mycophenolic acid. Reproduced with permission of the publisher.32
Conclusion
This study reviews nanoparticle-based optical sensors for the analysis of immunosuppressants such as cyclosporine A, tacrolimus, sirolimus, mycophenolate mofetil, and azathioprine covering the period up to 2024. A total of 10 articles were retrieved from the Scopus and PubMed databases. To facilitate easy comparison and access, the analytical parameters of each method were compiled in a Table. The results show that nanosensors can serve as a viable alternative to other methods including HPLC, capillary electrophoresis and electrochemical techniques, which are often limited by expensive equipment, high solvent consumption, labor-intensive sample preparation procedures, and the need for expertise in techniques. The widespread adoption of rapid detection methods for pharmaceuticals of this type appears to be lacking, leaving a significant gap in the field. This presents an exciting opportunity for the development of innovative analytical methods that can facilitate faster and more efficient detection. The design of new methods that can effectively address the challenges associated with the detection of these pharmaceuticals could have a profound impact on the pharmaceutical industry, enabling improved quality control, enhanced patient safety, and more efficient production processes. Therefore, this area offers a rich potential for future research and development in analytical method design.
Acknowledgments
Kader Poturcu acknowledged the Uzay Konstrüksiyon Sistemleri İnşaat Sanayi and Ticaret Anonim Şirketi, Türkiye.
Competing Interests
The authors declare that they have no known competing financial interests or personal relationships that could have appeared to influence the work reported in this paper.
Data Availability Statement
Data is available with the requests.
Ethical Approval
Not applicable.
References
- Girlanda R. Complications of post-transplant immunosuppression. In: Andrades JA, ed. Regenerative Medicine and Tissue Engineering. IntechOpen; 2013. 10.5772/55614.
- Martial LC, Aarnoutse RE, Schreuder MF, Henriet SS, Brüggemann RJ, Joore MA. Cost evaluation of dried blood spot home sampling as compared to conventional sampling for therapeutic drug monitoring in children. PLoS One 2016; 11(12):e0167433. doi: 10.1371/journal.pone.0167433 [Crossref] [ Google Scholar]
- Wiseman AC. Immunosuppressive medications. Clin J Am Soc Nephrol 2016; 11(2):332-43. doi: 10.2215/cjn.08570814 [Crossref] [ Google Scholar]
- Periman LM, Mah FS, Karpecki PM. A review of the mechanism of action of cyclosporine a: the role of cyclosporine a in dry eye disease and recent formulation developments. Clin Ophthalmol 2020; 14:4187-200. doi: 10.2147/opth.S279051 [Crossref] [ Google Scholar]
- Ong SC, Gaston RS. Thirty years of tacrolimus in clinical practice. Transplantation 2021; 105(3):484-95. doi: 10.1097/tp.0000000000003350 [Crossref] [ Google Scholar]
- Chatterjee SN. Immunosuppressive drugs used in clinical renal transplantation. Urology 1977; 9(6 Suppl):52-60. [ Google Scholar]
- Masaki Y, Nakase H, Tsuji Y, Nojima M, Shimizu K, Mizuno N. The clinical efficacy of azathioprine as maintenance treatment for autoimmune pancreatitis: a systematic review and meta-analysis. J Gastroenterol 2021; 56(10):869-80. doi: 10.1007/s00535-021-01817-9 [Crossref] [ Google Scholar]
- Santiago P, Schwartz I, Tamariz L, Levy C. Systematic review with meta-analysis: mycophenolate mofetil as a second-line therapy for autoimmune hepatitis. Aliment Pharmacol Ther 2019; 49(7):830-9. doi: 10.1111/apt.15157 [Crossref] [ Google Scholar]
- Freixo C, Ferreira V, Martins J, Almeida R, Caldeira D, Rosa M. Efficacy and safety of sirolimus in the treatment of vascular anomalies: a systematic review. J Vasc Surg 2020; 71(1):318-27. doi: 10.1016/j.jvs.2019.06.217 [Crossref] [ Google Scholar]
- Arena C, Bizzoca ME, Caponio VC, Troiano G, Zhurakivska K, Leuci S. Everolimus therapy and side-effects: a systematic review and meta-analysis. Int J Oncol 2021; 59(1):54. doi: 10.3892/ijo.2021.5234 [Crossref] [ Google Scholar]
- Iwata H, Iwaki H, Masukawa T, Kasamatsu S, Okamoto H. Anti-arthritic activity of bredinin, an immunosuppressive agent. Experientia 1977; 33(4):502-3. doi: 10.1007/bf01922237 [Crossref] [ Google Scholar]
- Miura A, Narita Y, Sugawara T, Shimizu H, Itoh H. Mizoribine promotes molecular chaperone HSP60/HSP10 complex formation. Int J Mol Sci 2024; 25(12):6452. doi: 10.3390/ijms25126452 [Crossref] [ Google Scholar]
- Alamri RD, Elmeligy MA, Albalawi GA, Alquayr SM, Alsubhi SS, El-Ghaiesh SH. Leflunomide an immunomodulator with antineoplastic and antiviral potentials but drug-induced liver injury: a comprehensive review. Int Immunopharmacol 2021; 93:107398. doi: 10.1016/j.intimp.2021.107398 [Crossref] [ Google Scholar]
- Seyfinejad B, Jouyban A. Overview of therapeutic drug monitoring of immunosuppressive drugs: analytical and clinical practices. J Pharm Biomed Anal 2021; 205:114315. doi: 10.1016/j.jpba.2021.114315 [Crossref] [ Google Scholar]
- Geddes CD, Lakowicz JR. Metal-enhanced fluorescence. J Fluoresc 2002; 12(2):121-9. doi: 10.1023/a:1016875709579 [Crossref] [ Google Scholar]
- Zhang Y, Aslan K, Previte MJ, Geddes CD. Metal-enhanced fluorescence: surface plasmons can radiate a fluorophore’s structured emission. Appl Phys Lett 2007; 90(5):053107. doi: 10.1063/1.2435661 [Crossref] [ Google Scholar]
- Golsanamlou Z, Soleymani J, Jouyban A. Sensing methods of immunosuppressant drugs: calcineurin inhibitors and purine synthesis inhibitor agents. ImmunoAnalysis 2021; 1(1):12. doi: 10.34172/ia.2021.12 [Crossref] [ Google Scholar]
- Choi JR, Shin DM, Song H, Lee D, Kim K. Current achievements of nanoparticle applications in developing optical sensing and imaging techniques. Nano Converg 2016; 3(1):30. doi: 10.1186/s40580-016-0090-x [Crossref] [ Google Scholar]
- Farka Z, Juřík T, Kovář D, Trnková L, Skládal P. Nanoparticle-based immunochemical biosensors and assays: recent advances and challenges. Chem Rev 2017; 117(15):9973-10042. doi: 10.1021/acs.chemrev.7b00037 [Crossref] [ Google Scholar]
- Sabela M, Balme S, Bechelany M, Janot JM, Bisetty K. A review of gold and silver nanoparticle‐based colorimetric sensing assays. Adv Eng Mater 2017; 19(12):1700270. doi: 10.1002/adem.201700270 [Crossref] [ Google Scholar]
- Ng SM, Koneswaran M, Narayanaswamy R. A review on fluorescent inorganic nanoparticles for optical sensing applications. RSC Adv 2016; 6(26):21624-61. doi: 10.1039/c5ra24987b [Crossref] [ Google Scholar]
- Parupudi A, Mulagapati SHR, Subramony JA. Nanoparticle technologies: recent state of the art and emerging opportunities. In: Kesharwani P, Singh KK, eds. Nanoparticle Therapeutics. Academic Press; 2022. p. 3-46. 10.1016/b978-0-12-820757-4.00009-0.
- Jahed FS, Hamidi S, Nemati M. Dopamine‐capped silver nanoparticles as a colorimetric probe for on‐site detection of cyclosporine. ChemistrySelect 2018; 3(47):13323-8. doi: 10.1002/slct.201802272 [Crossref] [ Google Scholar]
- Wells PK, Smutok O, Guo Z, Alexandrov K, Katz E. Nanostructured interface loaded with chimeric enzymes for fluorimetric quantification of Cyclosporine A and FK506. Anal Chem 2022; 94(20):7303-10. doi: 10.1021/acs.analchem.2c00650 [Crossref] [ Google Scholar]
- Golsanamlu Z, Soleymani J, Gharekhani A, Jouyban A. Two-photon fluorescence probe for quantification of cyclosporine. Mikrochim Acta 2023; 190(7):266. doi: 10.1007/s00604-023-05852-6 [Crossref] [ Google Scholar]
- Jiang X, Xu X, Kuang H, Liu L, Xu L, Qu A. A gold-based immunochromatographic strip for the specific detection of tacrolimus in whole blood. J Mater Chem B 2023; 11(20):4464-74. doi: 10.1039/d3tb00569k [Crossref] [ Google Scholar]
- Golsanamlu Z, Soleymani J, Gharekhani A, Jouyban A. In-situ preparation of norepinephrine-functionalized silver nanoparticles and application for colorimetric detection of tacrolimus in plasma samples. Heliyon 2023; 9(8):e18404. doi: 10.1016/j.heliyon.2023.e18404 [Crossref] [ Google Scholar]
- Zolgharnein J, Goudarzy F, Ghasemi JB. A novel g-C3N4@La:Y2O3 nanocomposite fluorescence sensor for simultaneous determination and photocatalytic degradation of ulipristal acetate and tacrolimus using Doehlert design optimization. J Photochem Photobiol A Chem 2024; 455:115789. doi: 10.1016/j.jphotochem.2024.115789 [Crossref] [ Google Scholar]
- Mohammad Almahri A, Jabli M. Successful spectrofluorometric and chemiluminescence methods for the estimation of azathioprine as an immunosuppressive drug in pharmaceutical preparation. Arab J Chem 2020; 13(12):8708-16. doi: 10.1016/j.arabjc.2020.10.001 [Crossref] [ Google Scholar]
- Barkat Rezaei Z, Rastegarzadeh S, Kiasat A. In-situ decorated silver nanoparticles on electrospun poly (vinyl alcohol)/chitosan nanofibers as a plasmonic sensor for azathioprine determination. Colloids Surf A Physicochem Eng Asp 2018; 559:266-74. doi: 10.1016/j.colsurfa.2018.09.047 [Crossref] [ Google Scholar]
- Jiang X, Xu X, Zeng L, Song S, Xu L, Kuang H. A gold-based immunochromatographic strip for the detection of sirolimus in human whole blood. Analyst 2022; 147(7):1394-402. doi: 10.1039/d1an02297k [Crossref] [ Google Scholar]
- Shi YQ, Xu Z, Wang L, Wang K, Xu L, Zheng H. The fluorescence and colorimetric dual-readout probe for clinical rapid detection of mycophenolic acid by the poly(ethylenimine)/silica-coated CdTe quantum dots. Anal Biochem 2023; 668:115090. doi: 10.1016/j.ab.2023.115090 [Crossref] [ Google Scholar]