ImmunoAnalysis. 5:5099.
doi: 10.34172/ia.025.5099
Original Article
Phenytoin Concentrations in Biological Fluids of Traumatic Brain Injury Patients
Atefeh Razavi Data curation, Investigation, Writing – original draft, 1
Ali Meshkini Formal analysis, Funding acquisition, Supervision, Writing – review & editing, 2
Mohammad Reza Afshar Mogaddam Formal analysis, Investigation, Writing – original draft, 3
Behrouz Seyfinejad Investigation, Writing – original draft, 1, 4
Maryam Khoubnasabjafari Conceptualization, Data curation, Methodology, Project administration, Supervision, Writing – review & editing, 5, 6, * 
Author information:
1Pharmaceutical Analysis Research Center, Tabriz University of Medical Sciences, Tabriz, Iran
2Department of Neurosurgery, Faculty of Medicine, Tabriz University of Medical Sciences, Tabriz, Iran
3Food and Drug Safety Research Center, Tabriz University of Medical Sciences, Tabriz, Iran
4Liver and Gastrointestinal Diseases Research Center, Tabriz University of Medical Sciences, Tabriz, Iran
5Tuberculosis and Lung Diseases Research Center, Tabriz University of Medical Sciences, Tabriz, Iran
6Department of Anesthesiology and Intensive Care, Faculty of Medicine, Tabriz University of Medical Sciences, Tabriz, Iran
Abstract
Background:
This study aims to determine and compare phenytoin concentrations in cerebrospinal fluid (CSF), serum, and urine. In addition, it strives to investigate their inter-correlations to provide insight into alternative monitoring methods.
Methods:
This study was conducted on 16 traumatic brain injury (TBI) patients admitted to the intensive care unit. Phenytoin concentrations were measured in CSF, serum, and urine samples using a liquid chromatography-tandem mass spectrometry. Statistical analysis assessed correlations between phenytoin levels across different samples and between concentrations and the received daily dose, age, and body mass index (BMI).
Results:
Phenytoin concentrations varied significantly between CSF, serum, and urine, with serum levels being the highest. Correlation analyses revealed significant positive correlations between phenytoin CSF and serum levels (r=0.83, P=0.0005), serum and urine levels (r=0.73, P=0.003), and CSF and urine levels (r=0.64, P=0.013). Serum concentrations were not influenced by age or BMI. No significant correlation was observed between phenytoin levels and its daily dose.
Conclusion:
This study demonstrated significant correlations between phenytoin levels in CSF and serum, suggesting that CSF could be a viable alternative for therapeutic drug monitoring (TDM) in TBI patients. However, urine concentrations were less reliable. Further studies with larger patient cohorts and different clinical settings are needed to validate these findings and explore the potential of CSF monitoring in routine clinical practice.
Keywords: Phenytoin, Cerebrospinal fluid, Serum, Urine
Copyright and License Information
© 2025 The Author(s).
This is an open access article distributed under the terms of the Creative Commons Attribution License (
http://creativecommons.org/licenses/by/4.0/), which permits unrestricted use, distribution, and reproduction in any medium, provided the original work is properly cited.
Funding Statement
This study was supported by Tabriz University of Medical Sciences (project number: 66071).
Introduction
Traumatic brain injury (TBI) is a serious health problem worldwide and its incidence in Iran is 15.3 to 144 per 100 000 population which mostly (60%) caused by road traffic accidents. According to a systematic review and meta-analysis study of Saheban Maleki et al,1 the mortality rate is 10.4%. Seizure is commonly observed in head trauma and also after brain surgery. Phenytoin is frequently used for prophylaxis of the epileptic seizures. The intended therapeutic serum concentration range of phenytoin for adults and children older than three months for the total concentration is 10–20 μg/mL (40–79 μmol/L)2, with a relatively limited free (unbound) concentration in the range of 1–2 μg/mL (total concentration/10).3 On the other hand, phenytoin has a narrow therapeutic index; low exposure may cause ineffective therapy and high exposure can result in serious neurological side effects. Alterations in acute phase reactant proteins, including serum albumin, as a result of critical illness or acute inflammatory conditions, can alter phenytoin binding, potentially bringing free phenytoin concentration to toxic levels. Other multiple factors such as age, alteration in hepatic functions, end-stage renal disease possibly due to accumulation of uremic toxins that lead to protein displacement of phenytoin, malnutrition, burn victims, head trauma, diabetes, hypercholesterolemia, hyperbilirubinemia, concomitant medications, and sepsis can change free phenytoin concentration. Drugs may also cause significant changes in the pharmacokinetics of phenytoin by changing its gastrointestinal absorption, plasma protein binding, and/or hepatic biotransformation (Table S1 of Supplementary file 1) and phenytoin is subjected to more drug-drug interactions among other anti-epileptic drugs.4
Metabolic rate of phenytoin is affected by age, sex, race, weight, renal and hepatic functions, therefore its serum concentration is further altered by these factors.5 The high degree of inter-individual variability in phenytoin pharmacokinetics is also due to polymorphisms in the CYP2C subfamily6 and transporter activities.7 Because of this high inter-individual variability, there is a poor correlation between phenytoin dosage and patient’s serum concentrations.2,7,8
In spite of these serious concerns, phenytoin dosing should be individualized by therapeutic drug monitoring (TDM). Furthermore, according to modern health care policies, treatment modalities are progressing towards individualization. As a first-line drug with complicated pharmacokinetics, relatively long half-life, and remarkable risk of drug interactions, TDM of total and, in certain patients, free phenytoin serum concentrations should be readily available in every laboratory to assist in the accurate and safe adjustment of the drug dosage, avoid inadequate drug exposure, optimize therapeutic efficacy, and minimize the risk of toxicity.9
Several studies have investigated the advantages and disadvantages of cerebrospinal fluid (CSF), serum, and urine samples for drug level monitoring. Although serum has the advantage of possessing established clinical ranges for monitoring patient compliance, urine/CSF reflects the free drug concentrations, making it an attractive specimen for drug monitoring.
The primary aim of this study is to investigate the correlation between phenytoin concentrations in serum, CSF, and urine in critically ill patients, particularly those with TBI or undergoing neurosurgery. By exploring these relationships, the study seeks to determine whether CSF and urine can be reliably used as alternative specimens for TDM of phenytoin, potentially offering less invasive options compared to traditional serum measurements. Additionally, the study aims to assess how variations in patient conditions such as body mass index (BMI) and drug dosage impact phenytoin pharmacokinetics, ultimately contributing to improved therapeutic strategies in this vulnerable patient population.
Materials and Methods
Patient population and sample collection
This is a non-blinded comparative study conducted in the Department of Neurosurgery, Imam Reza Hospital, Tabriz University of Medical Science, Tabriz, Iran. The samples were collected from May 2021 to December 2022. Specimens were taken after obtaining informed written consent from legal guardians, as the patients with the inclusion criteria of this study were unconscious or disoriented.
It is recognized that factors such as liver and kidney health, age, and sex could influence phenytoin pharmacokinetics. Therefore, inclusion criteria included all patients (regardless of age, sex, or disease) who had extra ventricle drainage (EVD) and receiving oral or intravenous phenytoin. Patients who did not consent to participate in research and sampling, themselves or their legal guardians were excluded from the study.
Relevant demographic and clinical data were collected from medical records of the patients. CSF, blood, and urine specimens were drawn with brief intervals. The CSF specimens were collected from the drainage (collection) bags of EVD system. The blood specimens were centrifuged at room temperature for 10 minutes at 4000 rpm, and the supernatant serum was carefully collected. The urine specimens were drawn from drainage tubes connected to the urinary catheters. All specimens were labeled and stored at -80 °C until analysis. CSF, serum, and urine samples were analyzed by a validated liquid chromatography mass spectrometry/mass spectrometry (LC-MS/MS) system.
Sample preparation
A stock solution of phenytoin was prepared at 100 mg/L as the standard solution, and a stock solution of carbamazepine was prepared at 100 mg/L and used as the internal standard (IS). Sample solutions were prepared by diluting appropriate amounts of stock solutions in water. CSF, serum, and urine samples were thawed to room temperature. 250 μL of urine sample and 50 μL of serum or CSF sample, which were vortexed for one minute to homogenize, were transferred to microtubes. 50 μL of carbamazepine solution was added as an IS.After vortexing for one minute, 250 μL of acetonitrile was added to precipitate the protein. The resultant solution was vortexed for another five minutes and then centrifuged for five minutes at 12 000 rpm, then was injected into the LC–MS/MS system.
Sample analysis
CSF, serum, and urine samples were analyzed by a LC system (Alliance separations module 2795 (Waters, Milford, MA, USA)), which consists of a quaternary solvent delivery system, degasser, autosampler, and column heater. MS detection was performed on a tandem mass spectrometer (Quadrupole mass spectrometer Quattro Micro (Waters-Micromass, UK) equipped with an electrospray source (Z-spray)). Data processing was performed using Mass Lynx software, version 4.1 for quantification. An Agilent analytical column (5 μm, C18, 100 × 2.1 mm) was used. The phenytoin concentration was quantified by ESI-MS/MS detection in positive ionization mode. The instrument settings were as follows: capillary voltage, 3.5 kV; cone, 30 V; collision energy offset, 30 V; extractor, 1 V; RF lens, 0 V; desolvation gas flow rate, 10 000 mL/min; source temperature, 110 °C; and desolvation temperature, 350 °C. The temperature of the column compartment was set to 35 °C. The mobile phase was an isocratic solvent system consisting of acetonitrile and formic acid 0.1% in a ratio of 70:30 (v/v), and the flow rate was 0.5 mL/min. Sample analysis was performed in multiple reaction monitoring modes (253.25 → 104.30 for phenytoin; 237.20 → 192.20 for the IS).
Method validation
Validation of an analytical method is an essential step for obtaining reliable and valid data.10 The employed analytical method was validated according to the guidelines of the European Medicines Agency on bioanalytical method validation and study sample analysis.11 The calibration curve was linearover a range of 15–5000 μg/L. The limit of quantification (LOQ) was 15 μg/L. The correlation coefficient (r) of the calibration curve was 0.997.
Statistical analysis
All data were analyzed by the IBM SPSS software package (V. 21). Correlations between phenytoin concentrations in different specimens were evaluated with Pearson coefficients. For orally administered cases, the dose was calculated as 0.90 of the oral dose (bioavailability = 90%). P values < 0.05 were considered significant.
Results
The study group included sixteen patients (nine females, seven males) with mean age ( ± standard deviation, SD) of 54.6 ± 23.4 years. The mean ( ± SD) daily dose of phenytoin was 214.62 ± 59.09 mg (range: 90–291.11 mg). The patients’ mean weight was 72.6 ± 19.8 kg, and the mean BMI was 27.0 ± 4.5. The patient characteristics and the measured phenytoin levels in the studied biological samples are listed in Table 1.
Table 1.
Patient characteristics and phenytoin concentrations in CSF, serum, and urine
|
No.
|
Weight (kg)
|
Height (cm)
|
BMI
|
Daily Dose (mg)a,b
|
CSF (μg/L)
|
Serum (μg/L)
|
Urine (μg/L)
|
| 1 |
70 |
168 |
24·80 |
270 |
197·80 |
142·19 |
13·40 |
| 2 |
68 |
170 |
23·53 |
180 |
106·32 |
2421·75 |
20·59 |
| 3 |
72 |
178 |
22·72 |
250 |
421·09 |
4283·31 |
76·90 |
| 4 |
95 |
185 |
27·76 |
250 |
674·71 |
5008·87 |
150·35 |
| 5 |
102 |
175 |
33·31 |
250 |
29·32 |
797·28 |
22·81 |
| 6 |
70 |
160 |
27·34 |
250 |
956·67 |
3976·34 |
70·27 |
| 7 |
35 |
110 |
28·93 |
162 |
18·86 |
133·35 |
32·01 |
| 8 |
95 |
178 |
29·98 |
207 |
23·96 |
381·76 |
36·08 |
| 9 |
80 |
165 |
29·38 |
291 |
177·49 |
1618·08 |
104·87 |
| 10 |
24 |
120 |
16·67 |
108 |
101·79 |
10·23 |
< LOQ |
| 11 |
84 |
155 |
34·96 |
266 |
174·18 |
1722·93 |
45·56 |
| 12 |
72 |
182 |
21·74 |
250 |
105·26 |
314·17 |
37·01 |
| 13 |
70 |
158 |
28·04 |
90 |
24·30 |
233·53 |
31·85 |
| 14 |
75 |
156 |
30·82 |
250 |
64·75 |
248·16 |
26·55 |
| 15 |
80 |
168 |
28·34 |
180 |
68·51 |
87·89 |
< LOQ |
| 16 |
70 |
168 |
24·80 |
180 |
104·67 |
1244·50 |
5·87 |
a For orally administered cases, dose was 0.90 of oral dose (bioavailability = 90%).
b The average dose received daily since the beginning of hospitalization.
Abbreviations: BMI: body mass index; CSF: cerebrospinal fluid; LOQ: limit of quantification.
The mean phenytoin concentration was 203.11 ± 263.77 μg/L in CSF, 1414.02 ± 1659.27 μg/L in serum, and 48.15 ± 39.85 μg/L in urine. In most of the patients, the serum concentrations were sub-therapeutic, that is, below 1000 μg/L. The correlations between the phenytoin dosage in mg/day and phenytoin CSF (r = 0.37, P = 0.15; Figure 1A), serum (r = 0.31, P = 0.24; Figure 1B), and urine (r = 0.39, P = 0.17; Figure 1C) concentrations were not statistically significant. The pharmacokinetics of phenytoin is non-linear even in its therapeutic range. In addition, its enzymatic metabolism is saturable, therefore with a small change in doses results in large deviations in serum concentrations. Considering these points, very large inter-individual variability (even up to 50 fold) in serum levels of phenytoin among different patients after receiving the same doses is expected.12
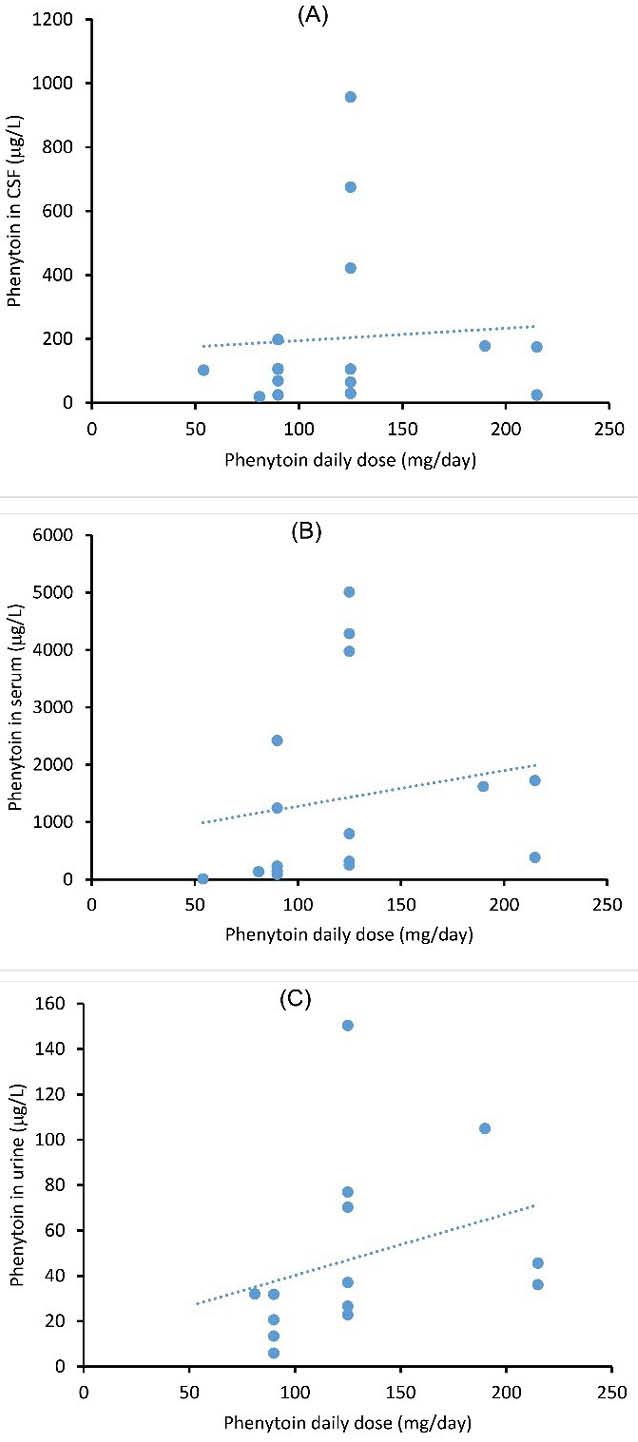
Figure 1.
Correlations between (A) daily dose and CSF concentration (B) daily dose and serum concentration (C) daily dose and urine concentration
.
Correlations between (A) daily dose and CSF concentration (B) daily dose and serum concentration (C) daily dose and urine concentration
There were significant correlations between the phenytoin CSF and serum levels (r = 0.83, P = 0.0005; Figure 2A), between the serum and urine levels (r = 0.73, P = 0.003; Figure 2B), and between the CSF and urine levels (r = 0.64, P = 0.013; Figure 2C).
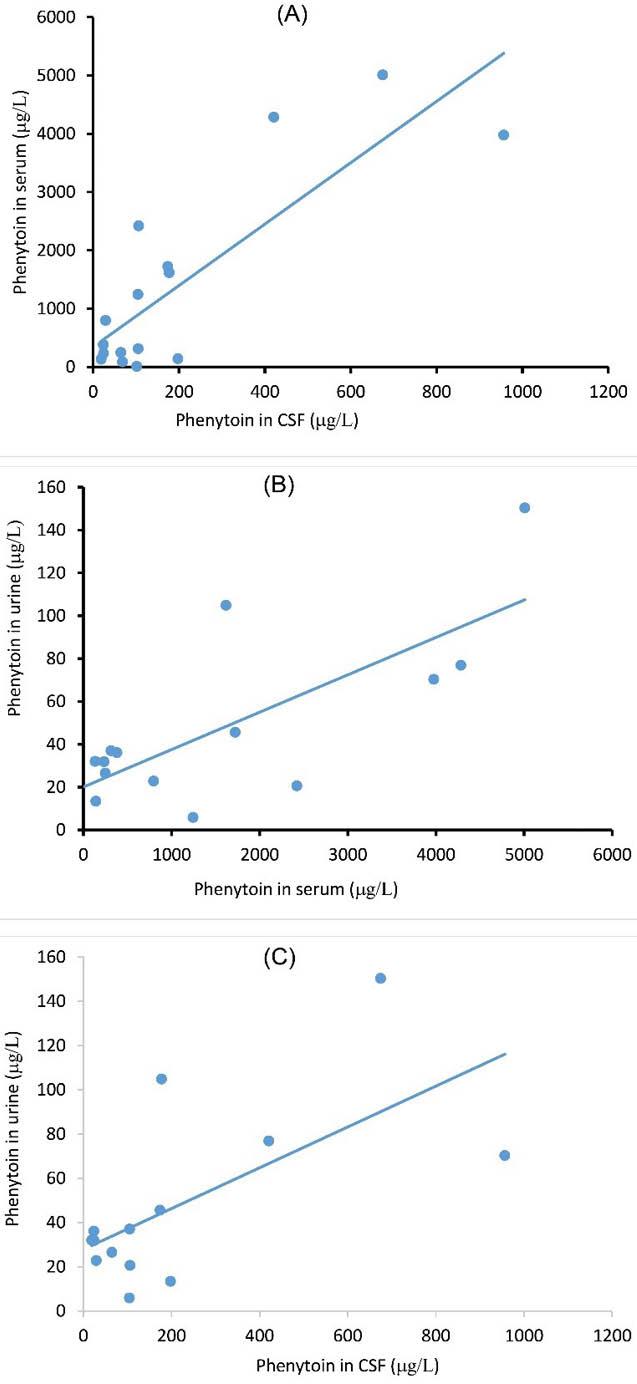
Figure 2.
Correlations between (A) phenytoin concentrations in CSF and serum (B) phenytoin concentrations in serum and urine (C) phenytoin concentrations in CSF and urine
.
Correlations between (A) phenytoin concentrations in CSF and serum (B) phenytoin concentrations in serum and urine (C) phenytoin concentrations in CSF and urine
Discussion
To the best of our knowledge, this is the first study reporting the phenytoin levels simultaneously in CSF, serum, and urine, and showed inter-correlations of phenytoin levels between mentioned specimens. About 5% of phenytoin was found unchanged in the urine samples.13 As predicted, our results were very close to that percentage (on average, 7% of the serum concentration). The correlation between serum and urine phenytoin concentrations was high (r = 0.73), which is in agreement with a previous report. 14 The correlation between CSF and urine phenytoin concentrations was also rather high (r = 0.64) and statistically significant. Using urine/CSF over serum has numerous advantages. One is that urine sampling is simple and noninvasive, and the procedure is less expensive and more convenient than a lumbar puncture and a blood draw. Moreover, urine does not require prior knowledge of albumin or total drug concentration. On the other hand, the effects of water intake and consequent dilution of the drug according to the urine volume, potential contamination, and insufficient excretion of phenytoin in urine are disadvantages of using urine samples. The justification for using urine for drug monitoring rests on the theory that urinary drug excretion represents free drug fraction. This seems to be reasonable for high protein-bound drugs like phenytoin. Regarding the CSF sample, its collection in our studied patients is not invasive and could be easily collected via EVD. However, in other patients (without EVD), the collection procedure is highly invasive and could not be recommended for routine applications. The main advantage of CSF is that it reflects the phenytoin concentration in its site of action.
In general, our inter-correlation results are largely consistent with those previously presented by others (see Table 2). As observed by Sherwin and Sokolowski,15 a similar correlation between phenytoin CSF and serum levels (r = 0.96 vs. r = 0.83); but a higher correlation compared with the study by Vajda et al16 (r = 0.58 vs. r = 0.83) were observed in this work. Likewise, for serum and urine correlation, a relatively similar correlation to the study by Borgå et al14 (r = 0.86 vs. r = 0.73) was obtained. These variations may be partially justified by methodological differences and/or small sample sizes. Our group of patients (n = 16) was larger than the groups in the three studies (n = 4, n = 10, and n = 7, respectively). It is acknowledged that the sample size of 16 patients is relatively small, which limits the external validity of the findings. Additionally, it will be suggested that future studies with larger cohorts are necessary to confirm the findings. A non-significant correlation between the daily dose of phenytoin and its serum concentration was observed in this study. Sharma et al.5 found a similar result despite the larger number of patients (r = 0.23 vs. r = 0.38).
Table 2.
Available studies on phenytoin concentrations in CSF, serum, or urine and theirinter-correlations
|
Studies
|
Sample/Analytical method
|
Correlation between
dose (mg/day) and
drug level
|
Correlations
between specimens
|
| This study |
n = 16
CSF; LC-MS/MS
Serum; LC-MS/MSa
Urine; LC-MS/MS |
CSF (r = 0.37)
Serum (r = 0.38)
Urine (r = 0.39) |
CSF and Serum (r = 0.83)
Serum and Urine (r = 0.73)
CSF and Urine (r = 0.64) |
| Vajda et al14 |
n = 10
CSF; GLC.a
Serum; GLC. |
|
CSF and Serum (r = 0.58) |
| Sherwin and Sokolowski13 |
n = 4
CSF; GLC.
Serum; GLC. |
|
CSF and Serum (r = 0.96) |
| Borgå et al15 |
n = 7
Urine; GC.
Serum; MF. |
|
Serum and Urine (r = 0.86) |
| Sharma et al5 |
n = 2888
Serum; an auto-analyzer using CEDIA® PHT II assay kits. |
Serum (r = 0.23) |
|
CSF: Cerebrospinal fluid; LC-MS/MS: Liquid chromatography coupled with tandem mass spectrometry; GLC: Gas-liquid chromatography; GC: Gas chromatography; MF: Mass fragmentography.
As mentioned, for most of the patients, the total serum concentrations obtained were below the therapeutic range, for which many reasons can be considered. Although the effect of concomitant medications on metabolism could not be specifically assessed due to the small sample size, the pharmacogenetic factors and the contribution of drug interactions to the observed sub-therapeutic results should not be ignored. However, these results are also largely in line with other similar studies on Iranian population; Alimardani et al17 observed 100% (n = 10), Shohrati et al18 100% (n = 10), Samadi et al19 85% (n = 17), and Hadidi et al20 70% (n = 10) of total serum phenytoin concentrations were below than the therapeutic range. But these percentages differ in the study settings, i.e. either non-hospitalized Iranian population 25% (n = 40)21 or critically ill non-Iranian population 53% (n = 57)3 and Singu et al. 46.4% (n = 56).2 It seems that more than one mechanism is involved in this variability. Increased probability of drug-drug interactions and increased metabolic rate due to stress-induced increase in hepatic metabolism may be involved in the difference between observations of studies on critically ill patients and those on non-hospitalized patients.22 The different reports among different populations may be the result of genetic as well as environmental factors. Genetic polymorphism in drug metabolism is an influencing factor in drug effect. It has also been reported that CYP2C9 and CYP2C19, the main metabolizing enzymes for phenytoin, may have quite different functions among different individuals and populations as a result of genetic polymorphism.6
After a brain injury due to head trauma or neurosurgeries (causes of hospitalization of our patients), multiple pharmacokinetic changes occur. These include blood-brain barrier disruption and changes in drug permeation from the blood into the CSF and CNS, cytokine release, which can affect the cytochrome P450 enzyme system, alteration in protein binding, drug transport, and hypothermia23,24 The inter-individual variability of CSF concentrations in our study may be partially attributed to the contribution of different degrees of mentioned changes. The observed variability of serum and CSF concentrations might also be due to pharmacokinetic differences between patients.
Although the concentrations of phenytoin in CSF were considerably lower than in serum, it might be sufficient to inhibit possible pathological processes occurring in the CNS leading to seizure. According to Temkin et al,25 administration of phenytoin in severe TBI shows a significant reduction in early post-traumatic seizures compared to placebo. Furthermore, CSF and serum phenytoin concentrations were highly correlated (r = 0.83) which is consistent with previous reports.14,15
While serum has the advantage of pre-established clinical ranges for monitoring patient compliance, urine requires a less invasive sampling method, making it a potential specimen for drug monitoring. CSF provides the concentration of drug in its site of action. It should be noted that other biological samples such as exhaled breath condensate26 or saliva27 could also be used as potential alternative samples in TDM studies.
Conclusion
This study explored the correlation of phenytoin concentrations across CSF, serum, and urine in critically ill patients. Significant correlations were found between these biological fluids, suggesting that CSF and urine could potentially serve as alternative specimens to serum for TDM. Despite the sub-therapeutic serum concentrations observed in many patients, which could be attributed to various pharmacogenetic factors and drug interactions, the consistent inter-correlations indicate that phenytoin levels in CSF and urine may still reflect drug exposure at its site of action. Further research is required to establish normalization factors and validate the use of CSF and urine as standard alternatives to serum for phenytoin monitoring in clinical practice.
Competing Interests
The authors declare that there are no conflicts of interest relevant to this work.
Data Availability Statement
Data will be available on request.
Ethical Approval
The study was approved by the Ethics Committee of the Tabriz University of Medical Sciences, (ID: IR. TBZMED. REC.1399.978). Informed consent was obtained from the patients.
Supplementary Files
Supplementary file 1 contains Table S1.
(pdf)
References
- Saheban Maleki M, Mazaheri SA, Hosseini SH, Askari Majdabadi H, Poursadeqiyan M, Faghihi A. Epidemiology of traumatic brain injury in Iran: a systematic review and meta-analysis. Iran J Public Health 2023; 52(9):1818-31. doi: 10.18502/ijph.v52i9.13565 [Crossref] [ Google Scholar]
- Singu BS, Morrison H, Irengeya L, Verbeeck RK. Therapeutic drug monitoring of phenytoin and valproic acid in critically ill patients at Windhoek Central Hospital, Namibia. Afr J Lab Med 2022; 11(1):1628. doi: 10.4102/ajlm.v11i1.1628 [Crossref] [ Google Scholar]
- Wilfred PM, Mathew S, Chacko B, Prabha R, Mathew BS. Estimation of free phenytoin concentration in critically ill patients with hypoalbuminemia: direct-measurement vs traditional equations. Indian J Crit Care Med 2022; 26(6):682-7. doi: 10.5005/jp-journals-10071-24235 [Crossref] [ Google Scholar]
- Chiș IA, Andrei V, Muntean A, Moldovan M, Mesaroș A, Dudescu MC. Salivary biomarkers of anti-epileptic drugs: a narrative review. Diagnostics (Basel) 2023; 13(11):1962. doi: 10.3390/diagnostics13111962 [Crossref] [ Google Scholar]
- Sharma S, Tabassum F, Dwivedi P, Agarwal R, Kushwaha S, Bala K. Critical appraisal of serum phenytoin variation with patient characteristics in a North Indian population. Neurol India 2015; 63(2):202-8. doi: 10.4103/0028-3886.156281 [Crossref] [ Google Scholar]
- Hung CC, Lin CJ, Chen CC, Chang CJ, Liou HH. Dosage recommendation of phenytoin for patients with epilepsy with different CYP2C9/CYP2C19 polymorphisms. Ther Drug Monit 2004; 26(5):534-40. doi: 10.1097/00007691-200410000-00012 [Crossref] [ Google Scholar]
- Patsalos PN, Berry DJ, Bourgeois BF, Cloyd JC, Glauser TA, Johannessen SI. Antiepileptic drugs--best practice guidelines for therapeutic drug monitoring: a position paper by the subcommission on therapeutic drug monitoring, ILAE Commission on Therapeutic Strategies. Epilepsia 2008; 49(7):1239-76. doi: 10.1111/j.1528-1167.2008.01561.x [Crossref] [ Google Scholar]
- Farrokh S, Tahsili-Fahadan P, Ritzl EK, Lewin JJ 3rd, Mirski MA. Antiepileptic drugs in critically ill patients. Crit Care 2018; 22(1):153. doi: 10.1186/s13054-018-2066-1 [Crossref] [ Google Scholar]
- Ter Heine R, Kane SP, Huitema AD, Krasowski MD, van Maarseveen EM. Nonlinear protein binding of phenytoin in clinical practice: development and validation of a mechanistic prediction model. Br J Clin Pharmacol 2019; 85(10):2360-8. doi: 10.1111/bcp.14053 [Crossref] [ Google Scholar]
- Seyfinejad B, Jouyban A. Importance of method validation in the analysis of biomarker. Curr Pharm Anal 2022; 18(6):567-9. doi: 10.2174/1573412918666211213142638 [Crossref] [ Google Scholar]
- European Medicines Agency. ICH Guideline M10 on Bioanalytical Method Validation and Study Sample Analysis. Available from: https://www.ema.europa.eu/en/documents/scientific-guideline/ich-guideline-m10-bioanalytical-method-validation-step-5_en.pdf. Accessed August 12, 2024.
- Aronson JK, Hardman M, Reynolds DJ. ABC of monitoring drug therapy Phenytoin. BMJ 1992; 305(6863):1215-8. doi: 10.1136/bmj.305.6863.1215 [Crossref] [ Google Scholar]
- Nation RL, Evans AM, Milne RW. Pharmacokinetic drug interactions with phenytoin (part I). Clin Pharmacokinet 1990; 18(1):37-60. doi: 10.2165/00003088-199018010-00003 [Crossref] [ Google Scholar]
- Borgå O, Hoppel C, Odar-Cederlöf I, Garle M. Plasma levels and renal excretion of phenytoin and its metabolites in patients with renal failure. Clin Pharmacol Ther 1979; 26(3):306-14. doi: 10.1002/cpt1979263306 [Crossref] [ Google Scholar]
-
Sherwin AL, Sokolowski CD, editors. Phenytoin and phenobarbitone levels in human brain and cerebrospinal fluid. In: Schneider H, Janz D, Gardner-Thorpe C, Meinardi H, Sherwin AL, eds. Clinical Pharmacology of Anti-Epileptic Drugs. Berlin: Springer; 1975. p. 274-80. doi: 10.1007/978-3-642-85921-2_28.
- Vajda F, Williams FM, Davidson S, Falconer MA, Breckenridge A. Human brain, cerebrospinal fluid, and plasma concentrations of diphenylhydantoin and phenobarbital. Clin Pharmacol Ther 1974; 15(6):597-603. doi: 10.1002/cpt1974156597 [Crossref] [ Google Scholar]
- Alimardani S, Sadrai S, Taghvaye Masoumi H, Salari P, Najafi A, Eftekhar B. Pharmacokinetic behavior of phenytoin in head trauma and cerebrovascular accident patients in an Iranian population. J Res Pharm Pract 2017; 6(4):217-22. doi: 10.4103/jrpp.JRPP_17_58 [Crossref] [ Google Scholar]
- Shohrati M, Mojtahedzadeh M, Rouini MR, Gholami K, Eftekhar B, Sadidi A. Correlation of free fraction of phenytoin and plasma albumin level in head trauma patients. Daru 2002; 10(1):1-5. [ Google Scholar]
- Samadi A, Khoubnasabjafari M, Barzegar M, Sadeghvand S, Shiva S, Jouyban A. Simultaneous determination of phenobarbital, phenytoin, carbamazepine and carbamazepine-10,11-epoxide in plasma of epileptic patients. Pharm Sci 2019; 25(4):345-51. doi: 10.15171/PS.2019.43 [Crossref] [ Google Scholar]
- Hadidi E, Mojtahedzadeh M, Rouini MR, Eftekhar B, Abdollahi M, Najafi A. The evaluation of the possible effect of positive end-expiratory pressure (PEEP) on pharmacokinetics of phenytoin in patients with acute brain injury under mechanical ventilation. Daru 2005; 13(2):74-81. [ Google Scholar]
- Salehifar E, Zohrabi M, Eshghi S, Saeedi M, Ebrahimi P. Different pharmacokinetic parameters of phenytoin in Iranian outpatients: need to optimize the current dosage administration. Iran J Pharm Res 2009; 8(1):37-45. doi: 10.22037/ijpr.2010.786 [Crossref] [ Google Scholar]
- Boucher BA, Kuhl DA, Fabian TC, Robertson JT. Effect of neurotrauma on hepatic drug clearance. Clin Pharmacol Ther 1991; 50(5 Pt 1):487-97. doi: 10.1038/clpt.1991.173 [Crossref] [ Google Scholar]
- Srisaeng K, Kanjanasilp J, Sriphong P, Kittivaravach C, Wongsrikaew P. Population pharmacokinetics of phenytoin in patients with traumatic brain injury. Chiang Mai Univ J Nat Sci 2015; 14(3):231-43. doi: 10.12982/cmujns.2015.0084 [Crossref] [ Google Scholar]
- Kalsotra A, Turman CM, Dash PK, Strobel HW. Differential effects of traumatic brain injury on the cytochrome p450 system: a perspective into hepatic and renal drug metabolism. J Neurotrauma 2003; 20(12):1339-50. doi: 10.1089/089771503322686139 [Crossref] [ Google Scholar]
- Temkin NR, Dikmen SS, Wilensky AJ, Keihm J, Chabal S, Winn HR. A randomized, double-blind study of phenytoin for the prevention of post-traumatic seizures. N Engl J Med 1990; 323(8):497-502. doi: 10.1056/nejm199008233230801 [Crossref] [ Google Scholar]
- Khoubnasabjafari M, Rahimpour E, Jouyban A. Exhaled breath condensate as an alternative sample for drug monitoring. Bioanalysis 2018; 10(2):61-4. doi: 10.4155/bio-2017-0205 [Crossref] [ Google Scholar]
- Alvarado A, García G, Morales A, Paredes G, Mora M, Muñoz AM. Phenytoin concentration in people with epilepsy: a comparative study in serum and saliva. Pharmacia 2022; 69(3):809-14. doi: 10.3897/pharmacia.69.e87168 [Crossref] [ Google Scholar]